Charting a bear raid: S&P 500, Nasdaq survive key technical tests
Focus: Easing interest rates and energy prices, 10-year yield violates 200-day average, Crude oil retests major support, TNX, USO, XLE
U.S. stocks are firmly higher early Tuesday, rising in the wake of the major benchmarks’ worst single-day downdraft of 2021.
Against this backdrop, the S&P 500 and Nasdaq Composite have effectively nailed major support — S&P 4,257 and Nasdaq 14,175 — and the prevailing upturn preserves a bullish technical bias.
Editor’s Note: As always, updates can be directly accessed at chartingmarkets.substack.com.
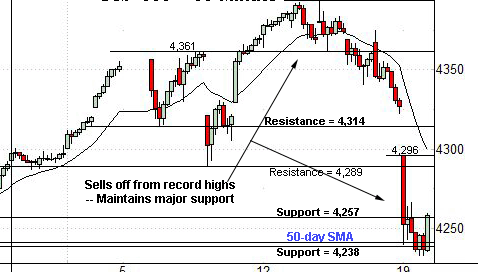
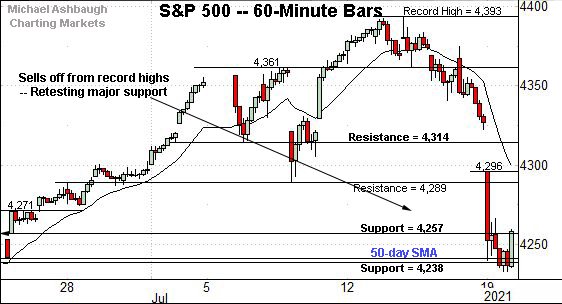
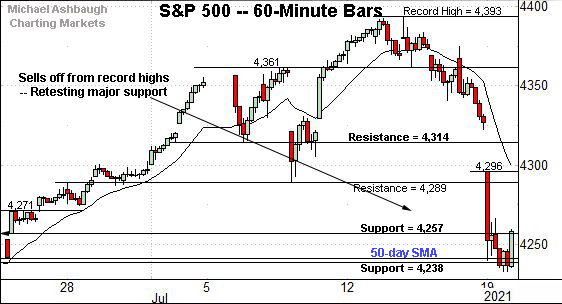
Before detailing the U.S. markets’ wider view, the S&P 500’s hourly chart highlights the past four weeks.
As illustrated, the S&P has narrowly maintained major support.
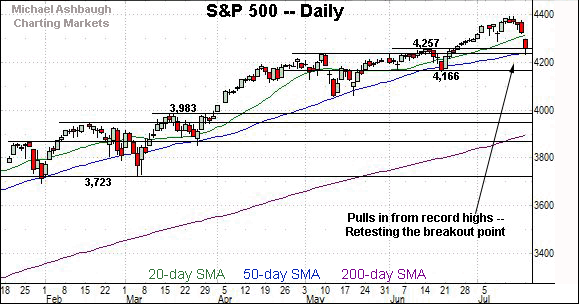
Consider that Monday’s close (4,258) matched the breakout point (4,257) to punctuate a jagged retest. (Also see the daily chart.)
Separately, the S&P has maintained its 50-day moving average, currently 4,242.
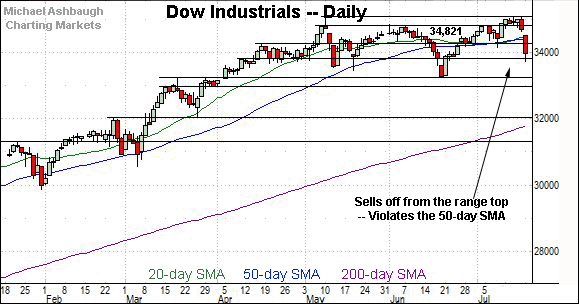
Similarly, the Dow Jones Industrial Average has plunged from its range top.
Recall last week’s high (35,090) missed the Dow’s record high (35,091) by about one point.
More immediately, the index has maintained next support — the 33,800 area — detailed Monday. (Also see the daily chart.)
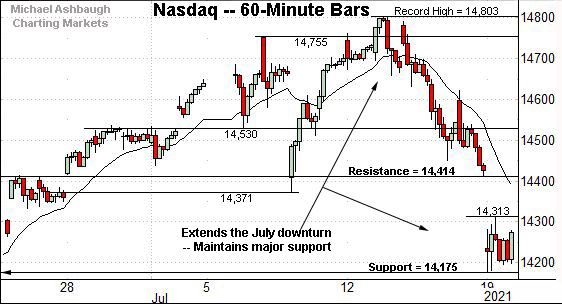
Against this backdrop, the Nasdaq Composite has also maintained major support.
Specifically, the week-to-date low (14,178) closely matched the Nasdaq’s breakout point (14,175) an area also detailed below.
More immediately, a retest of gap resistance (14,414) is already underway early Tuesday.
Recall last week’s low (14,413) matched the inflection point.
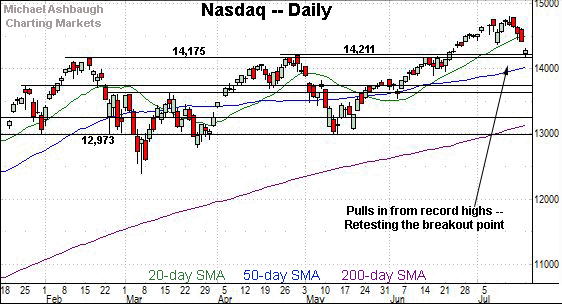
Widening the view to six months adds perspective.
On this wider view, the Nasdaq has effectively nailed major support.
To reiterate, the week-to-date low (14,178) has closely matched the Nasdaq’s breakout point (14,175).
Tuesday’s early upturn punctuates a successful retest amid a downturn that has inflicted limited damage in the broad sweep.
From current levels, near-term resistance matches the top of the gap (14,414) and last week’s low (14,413).
Looking elsewhere, the Dow Jones Industrial Average has pulled in sharply from its range top.
Recall last week’s high (35,090) missed the Dow’s record high (35,091) — established May 10 — by just one point.
Still, the downturn has initially been underpinned by the 33,800 support.
With Tuesday’s strong start, the 50-day moving average, currently 34,378, is followed gap resistance (34,528). A swift reversal higher would signal a false breakdown.
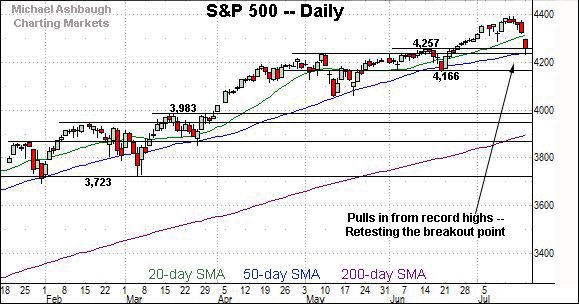
Meanwhile, the S&P 500 has nailed its first major support.
To reiterate, Monday’s close (4,258) matched the breakout point (4,257) to punctuate a successful retest. Constructive price action.
The bigger picture
As detailed above, the major U.S. benchmarks have likely weathered their first significant technical tests in several weeks.
On a headline basis, the S&P 500 and Nasdaq Composite have nailed major support — S&P 4,257 and Nasdaq 14,175.
Both areas are detailed on the daily charts, and Tuesday’s strong start likely punctuates successful retests.
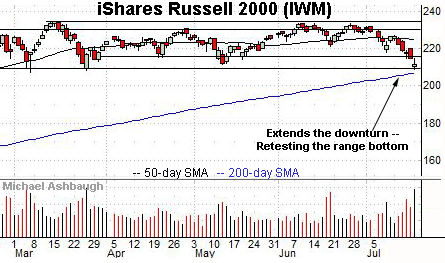
Moving to the small-caps, the iShares Russell 2000 ETF remains in divergence mode.
Still, the small-cap benchmark has thus far maintained major support, amid a volume spike.
Tactically, the range bottom, circa 209.30, is followed by the 200-day moving average, currently 207.08.
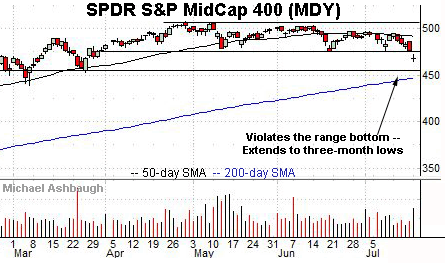
Meanwhile, the SPDR S&P MidCap 400 ETF has tagged three-month lows amid increased volume.
Tactically, the breakdown point — the 475.10-to-476.80 area — pivots to resistance.
A swift reversal higher — which looks likely early Tuesday — would signal a false breakdown.
Placing a finer point on the S&P 500, the index has plunged to a swift test of major support.
To reiterate, Monday’s close (4,258) effectively matched the breakout point (4,257) — an area detailed repeatedly — and also illustrated on the daily chart below.
More broadly, the S&P has also maintained its 50-day moving average, currently 4,242.
Though Monday’s session low (4,233) registered slightly under the trending indicator, the S&P has maintained the 50-day on a closing basis.
Since early November, prior tests of the 50-day moving average — (including single-session closing violations) — have marked intermediate-term lows, punctuated by a resumption of the uptrend.
Beyond technical levels, Monday’s downturn exhibited artificial/engineered traits, in some respects, selling pressure inconsistent with a material trend shift.
(In this vein, see for instance, the Dow industrials recent miss of record highs by just one point. The S&P 500 and Nasdaq Composite have subsequently nailed their respective breakout points.)
Still, the subsequent price action will ultimately set the technical trends.
Against this backdrop, more important S&P 500 support matches the June closing low (4,166). The S&P 500’s intermediate-term bias remains bullish, based on today’s backdrop, barring a violation of this area.
Editor’s Note: The next review will be published Thursday.
Watch List — Easing interest rates and energy prices
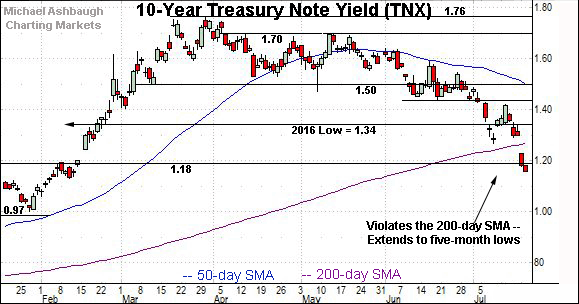
Drilling down further, the 10-year Treasury note yield has extended its downdraft.
Fundamentally, yields have arguably been pressured amid a flight-to-safety trade, a move that accelerated this week amid heightened virus concerns.
In the process, the 10-year yield has violated its 200-day moving average, currently 1.27, extending to five-month lows.
As detailed last week, the violation of the 1.27 area signals a primary trend shift.
Tactically, a swift reversal atop the 200-day moving average and the 2016 low (1.34) — which looks unlikely — would mark a step toward stabilization.
Conversely, the next downside inflection point rests in the 0.97-to-1.00 area.
(On a granular note, this week’s downturn also places the yield under its 50-week moving average (1.17) and 100-week moving average (1.21) consistent with a longer-term trend shift. See the yield’s two-year chart.)
Meanwhile, the United States Oil Fund has reached a major technical test. The fund tracks the spot price of light, sweet crude oil.
As illustrated, the shares staged a 6.7% daily downturn in Monday’s action, pressured amid concerns a virus resurgence could constrain economic activity.
In the process, the USO has violated its 50-day moving average, a recent intermediate-term inflection point. (See the March-through-May price action.)
Still, the downturn has initially been underpinned by the breakout point, circa 25.40.
Limited technical damage has thus far been inflicted — in the broad sweep — though the response to this area is worth tracking over the next several sessions.
Summing up the Treasury-yield and energy-price backdrop
Combined, easing interest rates and energy prices generally present an equity-market tailwind — to the extent the downturns are orderly.
But concerns surface to the extent the downturns reflect expectations for slowing global economic growth, or a pending recession.
Tactically, the USO’s retest of its breakout point — and the 10-year yield’s posture versus the 200-day moving average — are bull-bear gauges worth tracking.
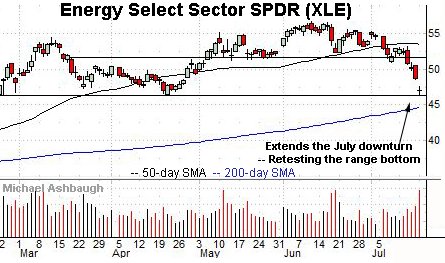
Finally, the Energy Select Sector SPDR — profiled Friday — has extended its downturn, pressured at least partly amid easing crude-oil prices.
This week’s follow-through punctuates a 17.1% pullback from the June peak, across about six weeks.
Technically, the five-month range bottom (46.25) marks major support.
The week-to-date low (46.30) has registered nearby.
The successful retest, and Tuesday’s strong start, likely lays the groundwork for at least a corrective bounce.
Beyond near-term bounces, an eventual violation of the range bottom (46.25) and the 200-day moving average, currently 44.68, would raise a technical red flag.
Editor’s Note: The next review will be published Thursday.

