Bull trend persists: S&P 500 and Nasdaq edge to uncharted territory
Focus: Regional banks test major resistance, Facebook and Alphabet stage breakouts ahead of earnings, KRE, FB, GOOGL, KO, INTC
U.S. stocks are mixed early Monday, largely treading water ahead of the Federal Reserve’s latest policy statement — due out mid-week — and an influential batch of quarterly earnings results from several so-called FANG names.
Against this backdrop, the S&P 500 and Nasdaq Composite are digesting their latest breaks to record territory.
Meanwhile, the Dow Jones Industrial Average has tagged a nominal record high, and is vying Monday to register a more decisive technical breakout.
Editor’s Note: As always, updates can be directly accessed at chartingmarkets.substack.com.
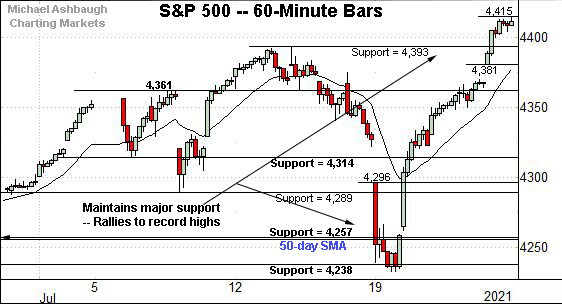
Before detailing the U.S. markets’ wider view, the S&P 500’s hourly chart highlights the past four weeks.
As illustrated, the S&P has extended to record highs, clearing the 4,400 mark for the first time on record.
Tactically, the former range top (4,393) is closely followed by gap support (4,381).
More broadly, the prevailing upturn originates from major support (4,257).
Recall the July closing low (4,258) registered nearby.
Meanwhile, the Dow Jones Industrial Average continues to challenge record territory.
Consider that last week’s high (35,095) marked a nominal new record, surpassing its former all-time high (35,091) — established May 10 — by less than four points.
In practice, the Dow’s breakout attempt remains underway.
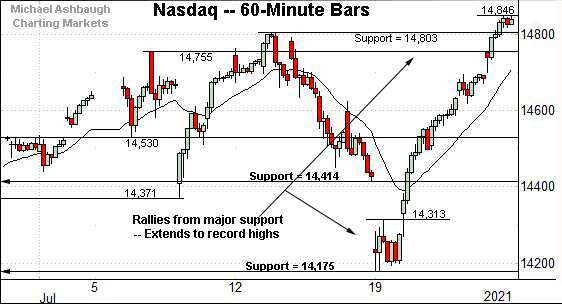
Against this backdrop, the Nasdaq Composite has also tagged record highs, breaking out slightly more decisively.
The prevailing upturn originates from major support (14,175), an area also illustrated below.
Recall last week’s low (14,178) registered just above support.
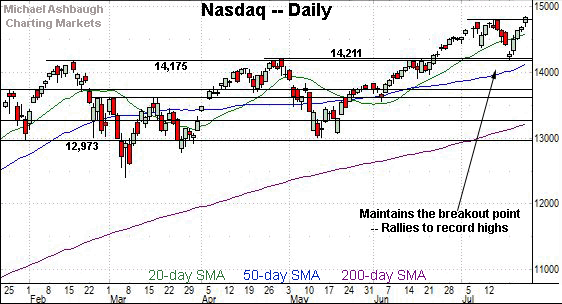
Widening the view to six months adds perspective.
On this wider view, the Nasdaq has rallied sharply from its breakout point (14,175), an area detailed repeatedly. (See for instance, the July 14 review.)
Last week’s low (14,178) matched support, and the index has subsequently knifed to a nominal record high. Bullish price action.
Tactically, a near-term target projects from the Nasdaq’s July range to the 15,428 area.
(Start with the former range top, and subtract the July low: 14,803 - 14,178 = 625 points. Then, add the result to the breakout point: 14,803 + 625 = 15,428.)
This matches the Nasdaq’s still-active intermediate-term projected target of 15,420, detailed previously. (See for instance, the June 23 review.)
Looking elsewhere, the Dow Jones Industrial Average is challenging record highs.
The prevailing upturn originates from a jagged test of the 33,800 area.
More broadly, the Dow is rising from a modified inverse head-and-shoulders pattern defined by the May, June and July lows.
Meanwhile, the S&P 500 has once again reached uncharted territory.
The prevailing upturn originates from the breakout point (4,257), an area matching the 50-day moving average, currently 4,262.
To reiterate, Monday’s close (4,258) matched the breakout point (4,257) amid a successful retest. Constructive price action.
The bigger picture
As detailed above, the major U.S. benchmarks are acting well technically.
On a headline basis, the S&P 500 and Nasdaq Composite have reached record territory, rising from major support — the S&P 4,257 and Nasdaq 14,175 areas.
Meanwhile, the Dow industrials have tagged a nominal record high, rising amid a breakout attempt that remains underway.
Moving to the small-caps, the iShares Russell 2000 ETF remains range-bound.
Within the range, the 50-day moving average, currently 224.94, marks a potential hurdle.
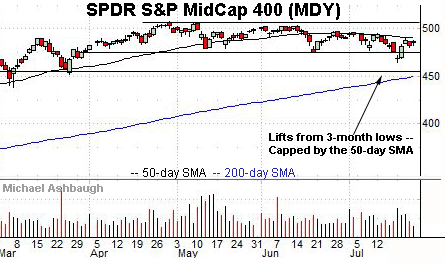
Meanwhile, the SPDR S&P MidCap 400 ETF has rallied to its former range from nearly four-month lows.
Here again, the 50-day moving average, currently 490.90, has marked a recent sticking point.
Placing a finer point on the S&P 500, the index has staged its latest breakout.
Tactically, the former range top (4,393) is closely followed by gap support (4,381).
Returning to the six-month view, the S&P’s prevailing upturn originates from major support (4,257), an area detailed repeatedly.
To reiterate, the July closing low (4,258) — established last week — effectively matched support.
Separately, the prevailing upturn also punctuates the latest successful test of the 50-day moving average, currently 4,262.
Since early November, retests of the 50-day moving average have marked intermediate-term lows, followed by an extension of the uptrend.
Tactically, upside targets project from the July range to the 4,510 and 4,553 areas.
More broadly, the S&P is vying this week to confirm its uptrend with more decisive follow-through. Its intermediate-term bias remains bullish, though amid still narrow sector leadership.
Editor’s Note: The next review will be published Wednesday.
Watch List
Drilling down further, the SPDR S&P Regional Banking ETF exemplifies a familiar concern. Namely, the broad-market rally has narrowed, and remains reliant on the so-called FANG names.
Technically, the group successfully retested its 200-day moving average, currently 59.62, at the July low.
Still, the subsequent rally from support has been flat — fueled by decreased volume — and capped by the breakdown point (63.60). Eventual follow-through atop this area would place the group on firmer ground.
Conversely, a failed test of resistance, and subsequent violation of the 200-day moving average, would raise the flag to a primary trend shift.
Moving to specific names, Facebook, Inc. continues to outperform.
As illustrated, the shares have recently maintained the 50-day moving average, an area closely matching the June breakout point.
The subsequent rally has been punctuated by a strong-volume break to record territory.
Tactically, the top of the gap (357.20) closely matches the breakout point. A sustained posture higher signals a bullish bias.
Note the company’s quarterly results are due out Wednesday, July 28.
Similarly, Alphabet, Inc. is acting well technically.
As illustrated, the shares have staged a strong-volume breakout, reaching record highs from a relatively tight July range.
Tactically, a near-term target projects to the 2,700 area.
Conversely, the breakout point (2,586.50) is followed by the former range bottom (2,470).
Note the company’s quarterly results are due out Tuesday, July 27.
More broadly, Facebook and Alphabet seem to have priced for well-received quarterly results ahead of the actual reports. A lackluster response to better-than-expected results would not be a complete surprise. (And poorly-received results could present a near-term headwind to the broad-market rally.)
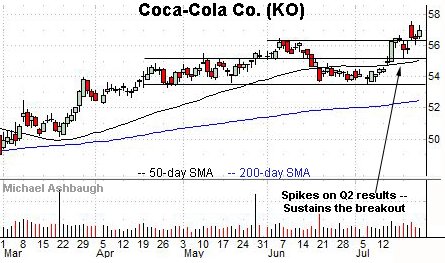
Coca-Cola Co. is a well positioned Dow 30 component. (Yield = 2.9%.)
Technically, the shares have recently knifed to 16-month highs, rising after the company’s second-quarter results.
The ensuing pullback has been flat, and underpinned by the breakout point (56.25). Bullish price action.
Delving deeper, the 50-day moving average (55.10) closely matches the former range top (55.20). A sustained posture higher signals a bullish bias.
Finally, Dow 30 component Intel Corp. has broken down technically.
As illustrated, the shares have tagged six-month lows, pressured after the company reported better-than-expected quarterly results, but also issued tepid guidance amid signs Advanced Micro Devices (AMD) may be taking market share.
The strong-volume downdraft places Intel under its 200-day moving average to punctuate a failed test of trendline resistance.
Tactically, a swift reversal atop the breakdown point (53.60), gap resistance (54.71) and the 200-day moving average (55.74) — an area closely matching the trendline — would neutralize the downdraft. The prevailing retest from underneath will likely add color.
Editor’s Note: The next review will be published Wednesday.


