Charting a double bottom, Nasdaq reaches uncharted territory
Focus: Brazil vies to extend uptrend, Tesla's trendline breakout, EWZ, TSLA, AMD, ULTA, DDD, PTON
U.S. stocks are higher early Friday, rising amid still rotational 2021 price action.
Against this backdrop, the S&P 500 and Nasdaq Composite have concurrently registered record highs this week, rising amid breakouts that get mixed marks for style.
Editor’s Note: As always, updates can be directly accessed at chartingmarkets.substack.com.
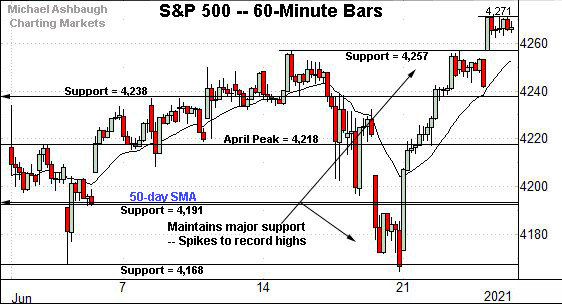
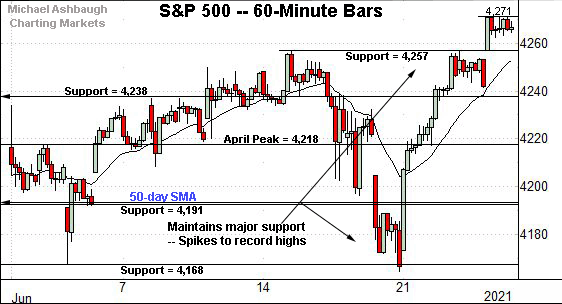
Before detailing the U.S. markets’ wider view, the S&P 500’s hourly chart highlights the past four weeks.
As illustrated, the S&P has cleared its range top, tagging its latest record high.
The nearly straightline spike originates from familiar support. Recall last week’s close (4,166) roughly matched the former range bottom (4,168) detailed repeatedly.
From current levels, the breakout point (4,257) closely matches the top of the gap (4,256.97).
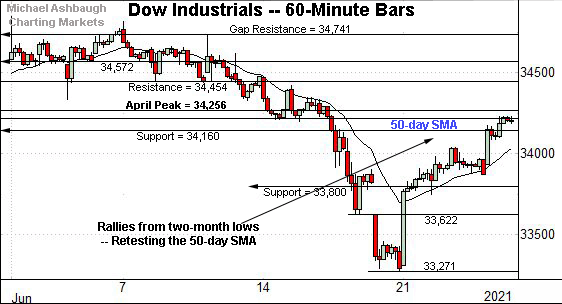
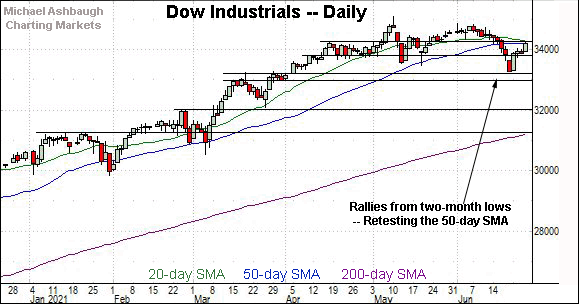
Meanwhile, the Dow Jones Industrial Average continues to lag behind.
Still, the index has rallied respectably from two-month lows, rising to retest the 50-day moving average, currently 34,210.
Thursday’s close (34,196) registered slightly under the 50-day, and the Dow has reclaimed the trending indicator with Friday’s strong start.
On further strength, the breakdown point (34,454) marks an overhead inflection point.
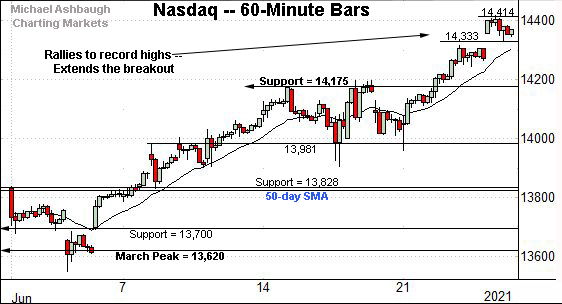
Against this backdrop, the Nasdaq Composite has extended its break to record territory.
Recall the breakout punctuates a jagged flag-like pattern, underpinned by near-term support (13,980).
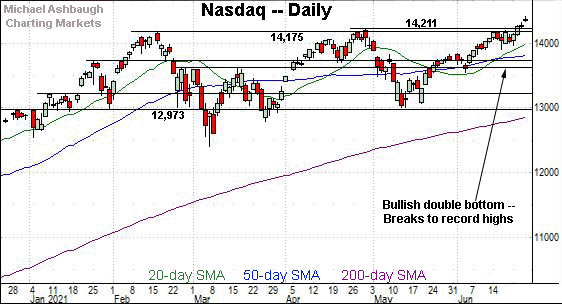
Widening the view to six months adds perspective.
On this wider view, the Nasdaq has extended its break to previously uncharted territory.
The prevailing upturn punctuates a sizeable double bottom defined by the March and May lows. Tactically, the index has already tagged its first target in the 14,380 area.
More broadly, an intermediate-term target projects from the double bottom to the 15,420 area.
Separately, the Nasdaq’s 1.1% breakout — through Thursday’s close — gets moderate marks for style, but is technically sufficient to confirm the primary uptrend.
Looking elsewhere, the Dow Jones Industrial Average remains the weakest major benchmark.
Still, the index has extended a bullish reversal from two-month lows.
Tactically, the index is retesting its 50-day moving average, currently 34,210, to conclude this week.
On further strength, additional overhead matches the breakdown point (34,454) an area better illustrated on the hourly chart.
Friday’s early session high (34,444) has registered nearby.
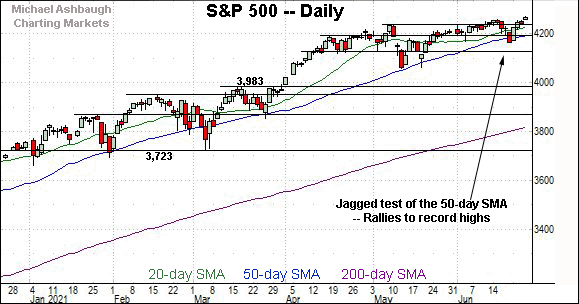
Meanwhile, the S&P 500 has registered a modest break to record highs.
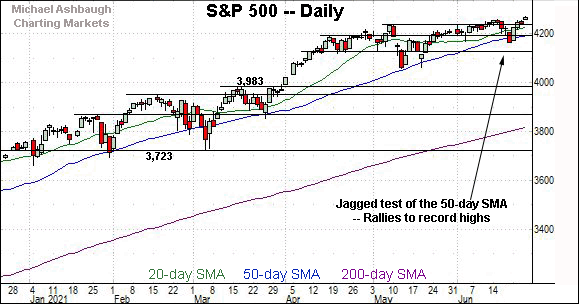
This week’s slight follow-through builds on the sluggish mid-June breakout, and punctuates a jagged test of the 50-day moving average, currently 4,192.
The bigger picture
Though the bigger-picture backdrop remains uneven, the major U.S. benchmarks are acting well technically, on balance, with just three sessions remaining in the second quarter.
On a headline basis, the S&P 500 and Nasdaq Composite have concurrently registered record highs, rising amid still rotational 2021 price action.
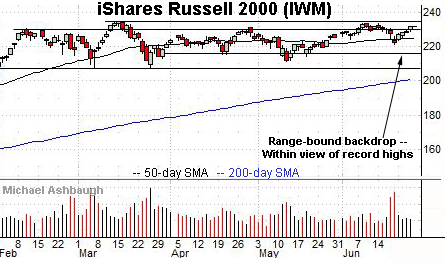
Moving to the small-caps, the iShares Russell 2000 ETF remains range-bound.
Nonetheless, the late-June upturn places record territory within view. Tactically, the record close (234.42) is closely followed by the absolute record peak (234.53).
Placing a finer point on the S&P 500, the index has reached uncharted territory.
The prevailing upturn punctuates a successful test of the range bottom (4,168), detailed previously.
Last week’s close (4,166) roughly matched support and has been punctuated by an aggressive bullish reversal.
More broadly, the June low — established last Friday — has punctuated the S&P’s third single-session close under the 50-day moving average since Nov. 4.
As with prior retests, the prevailing upturn has been punctuated by upside follow-through.
Though the week-to-date rally has been directionally sharp — which is bullish — the actual breakout has registered as sluggish, thus far falling firmly shy of a 1.0% technical breakout. (Recall the comparably lackluster mid-June breakout attempt.)
Nonetheless, the grinding-higher June price action is constructive in the broad sweep.
On further strength, an intermediate-term target projects from the May range to the 4,310 area — detailed repeatedly — and from the recent Fed-fueled whipsaw to the 4,350 area.
Watch List
Drilling down further, consider the following sectors and individual names:
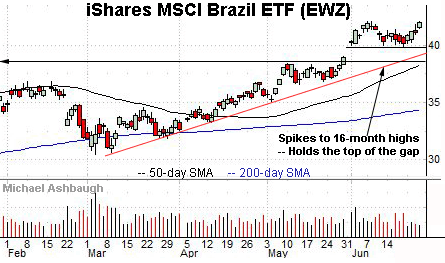
To start, the iShares MSCI Brazil ETF is acting well technically. (Yield = 1.8%.)
Earlier this month, the shares gapped to 16-month highs, rising amid increased volume. The subsequent pullback has been flat — underpinned by gap support (40.00) — positioning the shares to build on the initial spike.
Tactically, a near-term target projects to the 44.00 area on a break from the range top (42.05).
Conversely, trendline support is rising toward the June range bottom. The prevailing rally attempt is intact barring a violation.
More broadly, the shares are well positioned on the five-year chart, placing distance atop the 200-week moving average.
Tesla, Inc. is a large-cap name coming to life.
Technically, the shares have staged a trendline breakout, rising amid a volume spike.
Underlying the upturn, Tesla’s relative strength index (not illustrated) has tagged its best level since January, improving the chances of a durable trend shift.
Tactically, trendline support is closely followed by the 50-day moving average, currently 639.50, and the breakout point (628.50). The prevailing rally attempt is intact barring a violation.
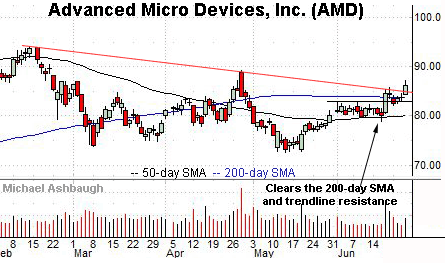
Initially profiled Monday, Advanced Micro Devices, Inc. has broken out.
The prevailing upturn builds on AMD’s mid-June rally atop the 200-day moving average.
More broadly, recall the developing double bottom defined by the March and May lows. Follow-through atop the April peak (89.20) would resolve the bullish pattern.
Tactically, trendline support is followed by the 200-day moving average, currently 83.82. The prevailing rally attempt is intact barring a violation.
On a granular note, the prevailing upturn punctuates a successful test of first support — the 81.50-to-82.30 area — detailed previously. The week-to-date low (82.21) has registered nearby.
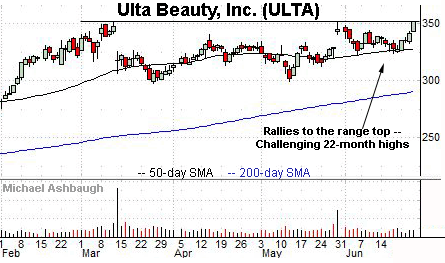
Ulta Beauty, Inc. is a well positioned large-cap specialty retailer.
As illustrated, the shares have rallied to the range top, rising to challenge 22-month highs. The prevailing upturn originates from the 50-day moving average.
Tactically, a near-term target projects to the 378 area on follow-through.
Conversely, a breakout attempt is in play barring a violation of near-term support, circa 342.00.
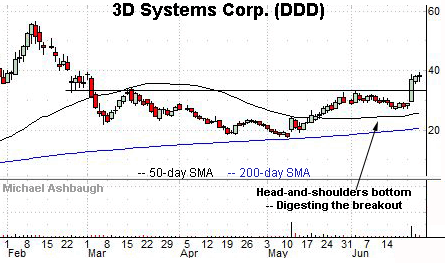
3D Systems Corp. is a mid-cap developer of 3D-printing technologies and digital-manufacturing solutions.
Earlier this week, the shares knifed to three-month highs, rising after the company announced a partnership with CollPlant Biotechnologies (CLGN) to develop solutions for breast reconstruction.
The strong-volume spike punctuates a head-and-shoulders bottom defined by the March, April and June lows. Tactically, a sustained posture atop the breakout point (33.00) signals a bullish bias.
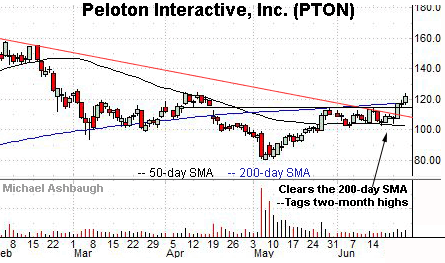
Finally, Peloton Interactive, Inc. — public since September 2019 — is a large-cap name coming to life.
Technically, the shares have reclaimed trendline resistance and the 200-day moving average across a three-session span.
Underlying the upturn, Peloton’s relative strength index (not illustrated) has registered five-month highs, improving the chances of incremental follow-through.
Tactically, the prevailing rally attempt is intact barring a violation of the breakout point (114.75) and slightly deeper trendline support.


