Charting a (slight) market divergence, Nasdaq nails major resistance
Focus: QQQ challenges record territory, IBM sustains technical breakout, QQQ, IBM, NTAP, CROX, CLF, FANG
U.S. stocks are mixed early Wednesday, largely treading water ahead the Federal Reserve’s widely anticipated policy statement, due out this afternoon.
Against this backdrop, the S&P continues to press record territory, while the Nasdaq Composite has pulled in modestly from major resistance (14,175) amid muted selling pressure.
Editor’s Note: As always, updates can be directly accessed at chartingmarkets.substack.com.
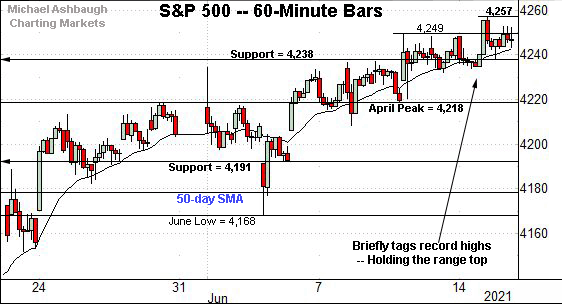
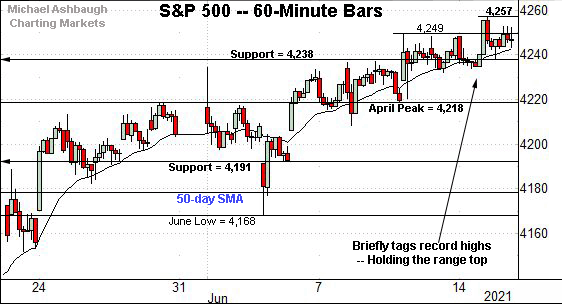
Before detailing the U.S. markets’ wider view, the S&P 500’s hourly chart highlights the past four weeks.
As illustrated, the S&P continues to press uncharted territory.
The index has registered a nominal record close (4,255.15) and absolute record peak (4,257.16) this week.
Conversely, consider that Tuesday’s session low (4,238) matched familiar support (4,238), detailed previously.
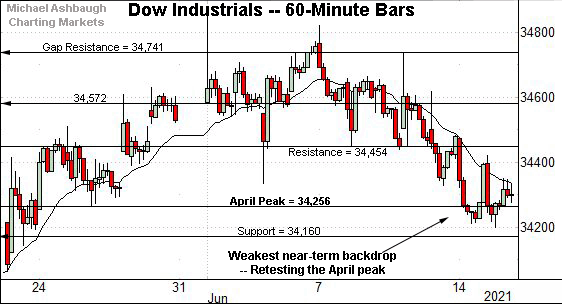
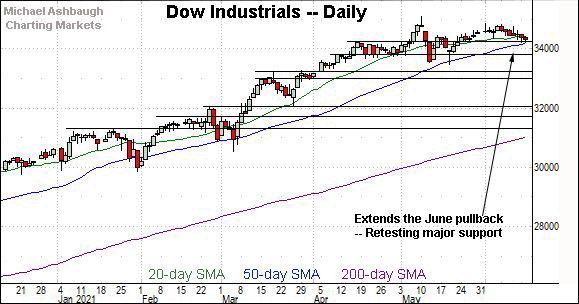
Meanwhile, the Dow Jones Industrial Average has extended a modest June downturn.
Tactically, the April peak (34,256) is followed by the Dow’s former range bottom (34,160).
Also recall the prevailing pullback originates from gap resistance (34,741). Thursday’s session high (34,738) registered nearby.
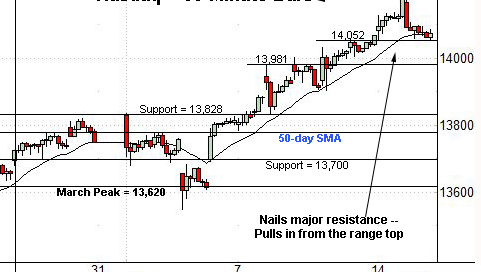
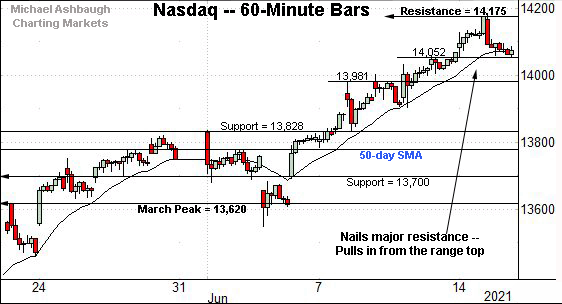
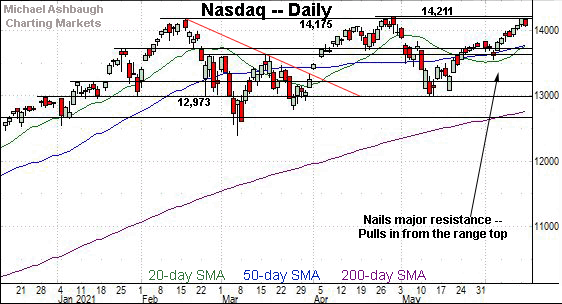
Against this backdrop, the Nasdaq Composite has nailed major resistance.
Consider that Monday’s session high (14,175) matched the Feb. peak (14,175) an area better illustrated below.
Conversely, near-term floors are not so well-defined. The 14,050 and 13,980 areas mark potential inflection points.
Widening the view to six months adds perspective.
On this wider view, the Nasdaq has nailed its range top. The week-to-date peak (14,175) has precisely matched the Feb. peak (14,175).
More broadly, the prevailing upturn punctuates a developing double bottom defined by the March and May lows. Follow-through atop the April peak (14,211.57) — a level defining the Nasdaq’s record peak — would resolve the bullish pattern.
Also recall the prevailing rally originates from major support matching the March peak (13,620). The June closing low (13,614) registered nearby.
Looking elsewhere, the Dow Jones Industrial Average continues to pull in as the Nasdaq extends higher.
Tactically, the 50-day moving average, currently 34,185, is rising toward major support matching the April peak (34,256).
Delving deeper, the 33,800 area is followed by the May low (33,473). An eventual violation would mark a “lower low” raising a question mark.
Meanwhile, the S&P 500 continues to press record highs.
This week’s grinding-higher follow-through punctuates a previously tight three-week range.
The bigger picture
Collectively, the bigger-picture backdrop remains bullish, even amid a modest, but persistent, June divergence.
On a headline basis, the S&P 500 and Nasdaq Composite have registered record closes this week. (Though the Nasdaq has stalled at the Feb. peak (14,175), Monday’s session close (14,174) marked a record close.)
Meanwhile, the Dow Jones Industrial Average has extended a June downturn, dropping within view of its 50-day moving average.
Amid the slight cross currents, each benchmark’s intermediate-term bias remains comfortably bullish.
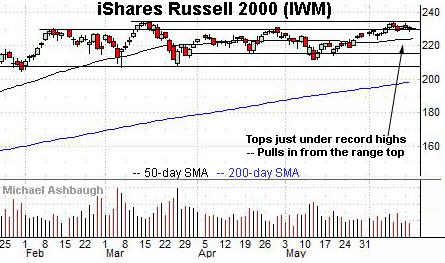
Moving to the small-caps, the iShares Russell 2000 ETF is hugging its range top, laying the groundwork for a potential breakout.
The small-cap benchmark’s record close (234.42) and absolute record peak (234.53) remain just overhead.
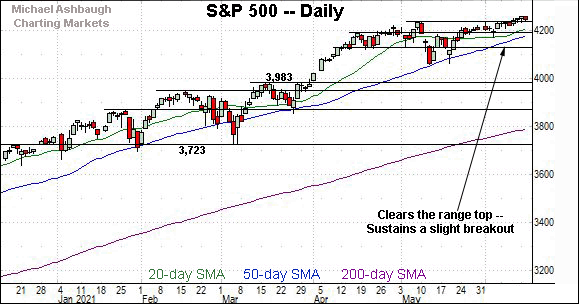
Placing a finer point on the S&P 500, the index continues to press record territory.
Consider that Monday’s session close (4,255.15) marked a record close.
Meanwhile, Tuesday’s session high (4,257.16) marked an absolute record peak.
In practice, a bull-flag breakout attempt remains underway. The S&P has yet to register decisive follow-through.
More broadly, the S&P 500’s jagged breakout attempt punctuates a previously tight three-week range.
Tactically, familiar downside inflection points remain in play. The S&P’s former breakout point (4,191) is followed by the the ascending 50-day moving average, currently 4,178, and the June low (4,168). A sustained posture higher signals a comfortably bullish intermediate-term bias.
Conversely, a familiar near-term target continues to project to the 4,310 area. Beyond specific levels, the response to the Federal Reserve’s long-awaited policy statement — (in the context of largely flat June price action) — will likely add color.
Editor’s Note: The next review will be published Friday.
Watch List
Drilling down further, consider the following sectors and individual names:
To start, the Invesco QQQ Trust tracks the Nasdaq 100 Index.
Technically, the shares started the week with a modest breakout — briefly tagging record highs — and have since held tightly to the range top. An intermediate-term target projects to the 367 area on follow-through.
Conversely, the breakout point, circa 342.50, is followed by the 50-day moving average, currently 334.20, a recent bull-bear inflection point. A sustained posture higher signals a bullish bias.
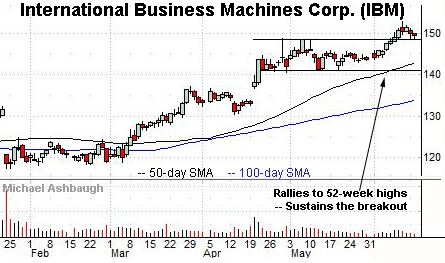
International Business Machines Corp. is a well positioned Dow 30 component. (Yield = 4.4%.)
Earlier this month, the shares knifed to 52-week highs, clearing resistance matching the May peak.
The subsequent pullback has been flat, placing the shares 2.3% under the June peak. Tactically, the breakout point (148.50) is followed by the mid-May range top (145.80).
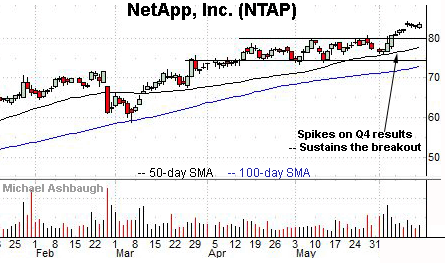
NetApp, Inc. is a well positioned large-cap data storage name.
The shares started June with a breakout, knifing to 31-month highs after the company’s quarterly results.
More immediately, the prevailing flag-like pattern has formed amid decreased volume, positioning the shares to build on the initial rally. Tactically, the post-breakout low (82.40) is followed by the firmer breakout point (80.00).
Crocs, Inc. is a well positioned large-cap footwear maker.
The shares initially spiked seven weeks ago, gapping sharply higher after the company’s quarterly results.
The June follow-through punctuates a relatively tight range, positioning the shares to build on the steep April spike. Tactically, a sustained posture atop the breakout point (108.80) signals a firmly-bullish bias.
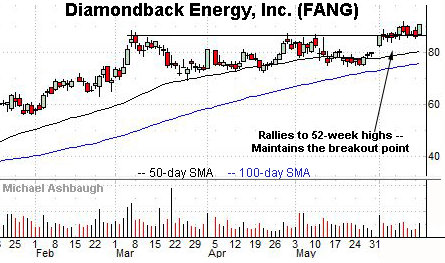
Diamondback Energy, Inc. is a well positioned large-cap oil and gas name.
Earlier this month, the shares rallied to 52-week highs, rising amid increased volume. The upturn punctuated a double bottom, defined by the March and May lows.
More immediately, the prevailing flag pattern has been underpinned by the breakout point (86.50), positioning the shares to extended the rally. Tactically, a sustained posture atop gap support (82.40) signals a bullish bias.
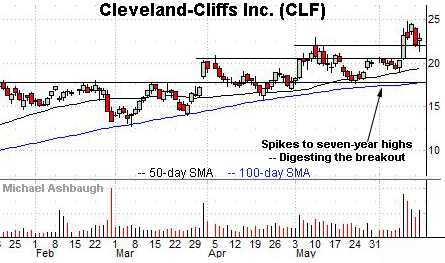
Cleveland-Cliffs, Inc. is a well positioned large-cap steel producer.
Earlier this month, the shares staged a strong-volume breakout, knifing to seven-year highs.
The subsequent pullback places the shares near the breakout point (21.95) and 8.4% under the June peak.
Tactically, deeper support matches the former range top (20.70). The prevailing rally attempt is intact barring a violation.
Editor’s Note: The next review will be published Friday.

