Charting a Fed-fueled whipsaw, S&P 500 challenges 50-day average
Focus: Charting cross currents across asset classes, XLF, TRAN, QQQ, UUP, FXE, GLD
U.S. stocks are firmly lower early Friday, pressured amid potentially consequential Fed-fueled market price action.
Against this backdrop, the S&P 500 is challenging its 50-day moving average, currently 4,182, as it vies to avoid just its third close under the trending indicator since Nov. 4.
Editor’s Note: As always, updates can be directly accessed at chartingmarkets.substack.com.
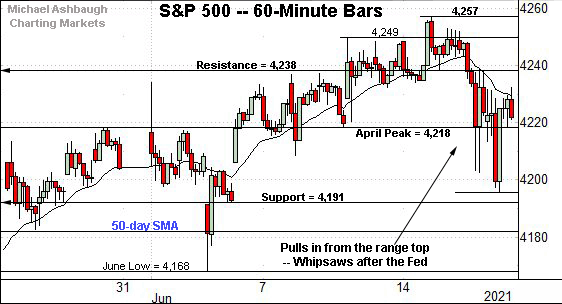
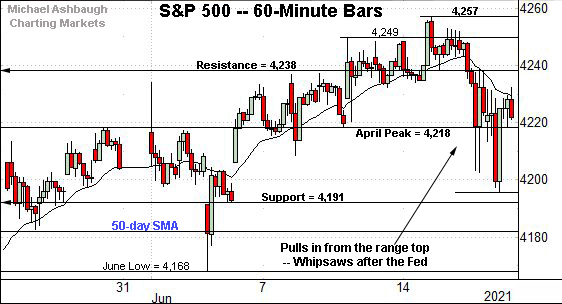
Before detailing the U.S. markets’ wider view, the S&P 500’s hourly chart highlights the past four weeks.
As illustrated, the S&P has extended a pullback from record highs, pressured amid Fed-induced volatility.
Tactically, major support (4,191) is followed by the 50-day moving average, currently 4,182, and the June low (4,168).
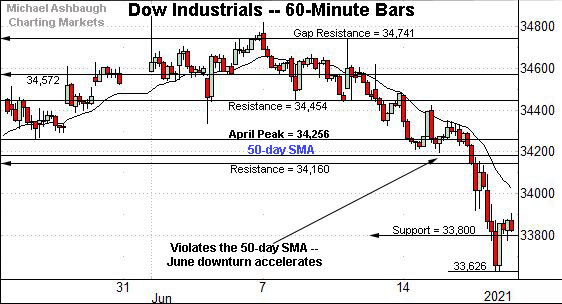
Meanwhile, the Dow Jones Industrial Average has extended a more damaging pullback.
The downturn has accelerated amid the Dow’s violation of its 50-day moving average, currently 34,184.
Slightly more broadly, notice the 20-hour moving average has capped the prevailing pullback, the hallmark of a strong near-term downtrend.
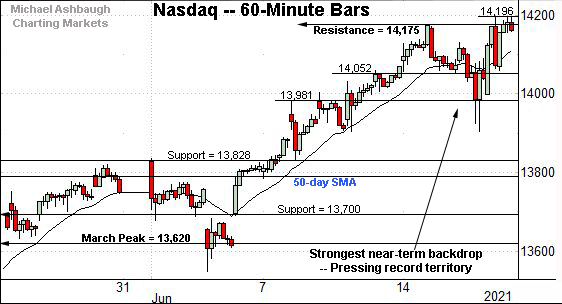
Against this backdrop, the Nasdaq Composite has challenged its range top.
The week-to-date peak (14,196) has registered within 15 points of its absolute record peak (14,211), a level illustrated below.
More immediately, Friday’s early session low (14,054) roughly matched near-term support (14,052), detailed previously.
Widening the view to six months adds perspective.
On this wider view, the Nasdaq has challenged record highs this week.
The relatively tight week-to-date range signals muted selling pressure near resistance, improving the chances of eventual follow-through.
Also recall the prevailing upturn punctuates a developing double bottom defined by the March and May lows. Follow-through atop the April peak (14,211.57) would resolve the bullish pattern.
Viewed in isolation, the Nasdaq’s backdrop supports a bullish intermediate-term bias.
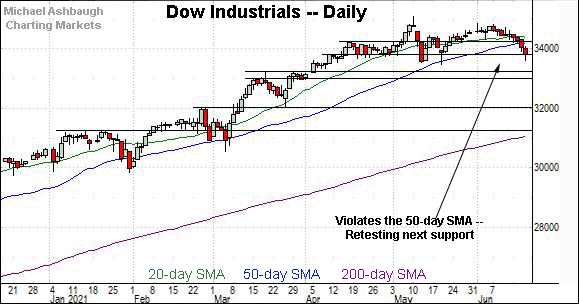
Looking elsewhere, the Dow Jones Industrial Average has extended a persistent June downturn.
Selling pressure has accelerated amid this week’s violation of the 50-day moving average, currently 34,184.
More immediately, the Dow has ventured early Friday under the 33,800 support and the May low (33,473).
Tactically, a sustained posture lower would mark a “lower low” — combined with a violation of the 50-day moving average — raising technical caution flag. Notice the bearish double top defined by the May and June peaks.
Meanwhile, the S&P 500 has staged a less-damaging pullback from record highs — at least so far.
Still, the index is challenging major support (4,191) early Friday, as well as the 50-day moving average, currently 4,182.
The bigger picture
Collectively, the major U.S. benchmarks have diverged this week, pressured at least partly amid Fed-fueled market cross currents.
Against this backdrop, the Dow Jones Industrial Average has violated its 50-day moving average, extending to two-month lows early Friday. A weekly close near Friday’s early session lows would punctuate a double top, signaling a bearish intermediate-term bias.
Meanwhile, the Nasdaq Composite has strengthened versus the other benchmarks, tagging a week-to-date peak within 15 points of its record high.
The S&P 500’s backdrop roughly splits the difference between that of the other benchmarks.
Fundamentally, the week-to-date price action has been punctuated by an arguably paradoxical market response to the Federal Reserve’s policy statement.
The unexpectedly hawkish-leaning statement has been punctuated by easing Treasury yields — contrary to expectations — contributing to the technology sector’s resilience.
Put differently, the Nasdaq seems to be responding to what yields are actually doing, whereas the financials, transports, industrials etc. seem to be responding to the hawkish policy language itself.
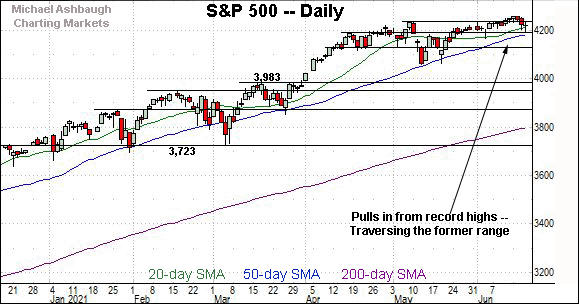
Placing a finer point on the S&P 500, the index has extended a jagged pullback from its record high, established Tuesday.
The downturn places notable technical levels in play.
To reiterate, major support (4,191) is followed by the 50-day moving average, currently 4,182, and the June low (4,168).
Tactically, the S&P 500 has registered just two closes under its 50-day moving average since Nov. 4.
So a weekly close under the 50-day, currently 4,182, and the June low (4,168) would raise a question mark.
Delving deeper, the S&P’s former range bottom (4,118) is followed by likely last-ditch support matching the May low (4,056). An eventual violation would mark a material “lower low” — combined with the violation of the 50-day moving average — more firmly signaling an intermediate-term trend shift.
As always, it’s not just what the markets do, it’s how they do it.
Tactically, the S&P 500’s intermediate-term bias remains guardedly bullish based on today’s backdrop. The weekly close, and the next several sessions, will likely add color.
Charting Fed-fueled market cross currents and volatility
Drilling down further, potentially consequential cross currents across sectors — and asset classes — have registered after the Federal Reserve’s latest policy statement. This marks a potential departure from the norm, as Fed-policy language more frequently induces market whipsaws on the order of one- to two-day wonders.
The traditional sector leaders exemplify the prevailing U.S. sector backdrop:
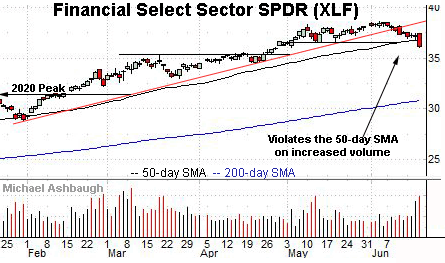
To start, the Financial Select Sector SPDR has violated its 50-day moving average, tagging six-week lows.
The strong-volume downturn punctuates a “lower low” technically confirming the mid-month trend shift.
Tactically, a swift reversal atop the breakdown point (36.55) and the 50-day moving average, currently 36.80, would place the brakes on bearish momentum.
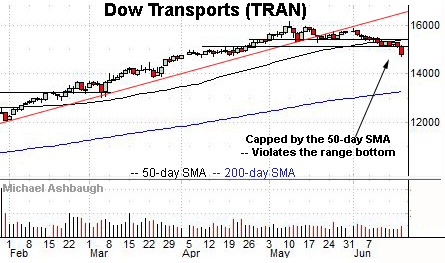
Meanwhile, the Dow Transports have staged a bull-flag breakdown, tagging two-month lows.
The prevailing downturn punctuates a tight mid-June range capped by the 50-day moving average.
Tactically, a reversal atop the breakdown point (15,140) and the 50-day would place the group on firmer technical ground.
Meanwhile, the Invesco QQQ Trust — profiled Wednesday — offers a large-cap technology sector proxy.
Technically, the shares continue to press record territory amid a bull-flag breakout attempt. Recall that an intermediate-term target projects to the 367 area.
Conversely, the breakout point, circa 342.50, is followed by the 50-day moving average, currently 334.60. A sustained posture higher signals a bullish bias.
More broadly, the Fed-fueled market whipsaw has inflicted damage to the U.S. sub-sector backdrop. Though large-cap technology has thus far weathered the volatility spike, the industrials, materials and metals have joined the transports and financials, registering strong-volume downdrafts amid violations of the 50-day moving average.
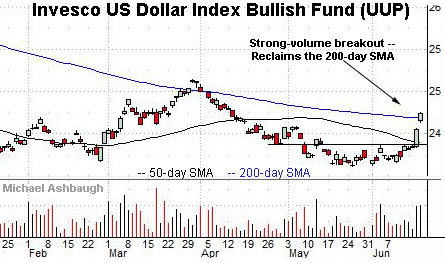
Moving to currencies, the U.S. dollar has broken out, rising after the Fed’s hawkish-leaning policy statement. (Rising yields make the native currency, in this case the dollar, more attractive vs. competing currencies, sending the dollar higher.)
In the process, the Invesco U.S. Dollar Index Bullish Fund has knifed atop its 200-day moving average, currently 24.69.
As always, the 200-day moving average is a widely-tracked longer-term trending indicator. Tactically, a sustained posture atop the 200-day, and gap support (24.56) signals a bullish-leaning longer-term bias.
Conversely, the Invesco Currency Shares Euro Trust has broken down technically, violating its 50- and 200-day moving averages across consecutive sessions.
As always, the U.S. dollar and euro are inversely correlated.
Tactically, a swift reversal atop gap resistance (112.17) and the 200-day moving average would place the brakes on bearish momentum.
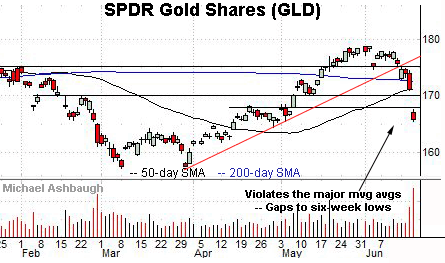
Similarly, the SPDR Gold Shares ETF has broken down technically as it paces its worst weekly performance in 15 months.
Here again, the U.S. dollar and gold are inversely correlated.
Tactically, gap resistance (167.62) is followed by the 50-day moving average. A reversal atop this area would mark a step toward stabilization.
More broadly, the cross currents detailed signal markets that have been genuinely surprised by the Federal Reserve’s policy adjustments. Time will tell whether the volatility spike marks a typical fleeting Fed-induced whipsaw, or instead, registers as more technically consequential. Based on today’s backdrop, the latter looks more likely.


