Charting a bullish reversal, S&P 500 (narrowly) maintains key support
Focus: Europe retests the breakout point, Japan presses major support, IEV, EWJ, AMD, LSPD, TEAM
U.S. stocks are firmly higher early Monday, rising in the wake of last week’s aggressive Fed-fueled market downdraft.
Against this backdrop, the S&P 500 has rallied from a jagged, but apparently successful, test of notable support (4,168) detailed previously. Last week’s close (4,166) registered nearby.
Editor’s Note: As always, updates can be directly accessed at chartingmarkets.substack.com.
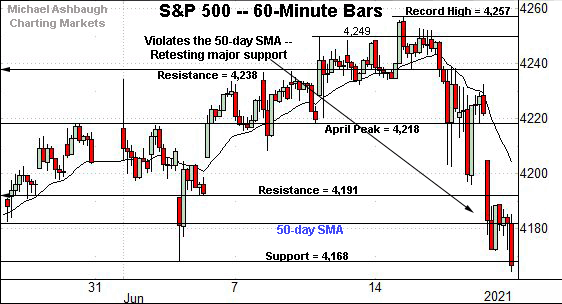
Before detailing the U.S. markets’ wider view, the S&P 500’s hourly chart highlights the past four weeks.
As illustrated, the S&P violated its 50-day moving average, currently 4,183, to conclude last week.
Monday’s strong start places it back atop the trending indicator.
Tactically, the former range bottom (4,191) is followed by the April peak (4,218).
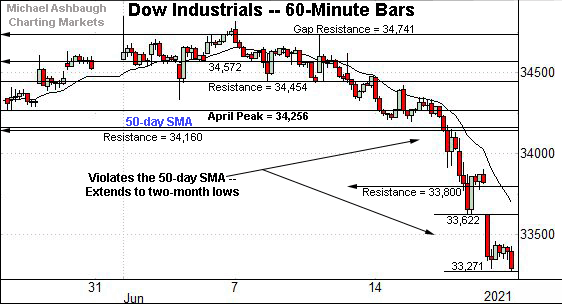
Meanwhile, the Dow Jones Industrial Average has pulled in more aggressively.
Recall the downturn accelerated amid its violation of its 50-day moving average, currently 34,183.
Tactically, the 33,800 area marks notable overhead, an area also detailed on the daily chart.
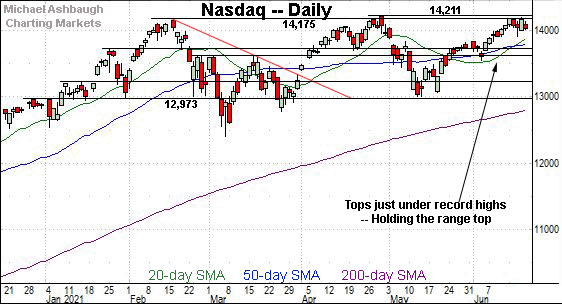
True to recent form, the Nasdaq Composite remains the strongest major benchmark.
Tactically, last week’s high (14,196) missed a record high by just 15 points.
The index has since held relatively tightly to its range top, an area also illustrated below.
Widening the view to six months adds perspective.
On this wider view, the Nasdaq continues to hold its range top, even amid pronounced selling pressure in spots elsewhere.
The prevailing upturn punctuates a developing double bottom defined by the March and May lows. Follow-through atop the April peak (14,211.57) would resolve the bullish pattern.
Recall the tight mid-June range signals muted selling pressure near resistance, improving the chances of an eventual breakout.
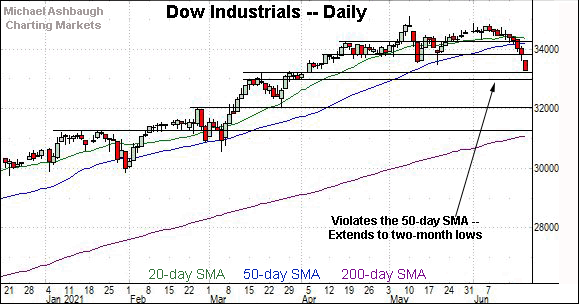
Looking elsewhere, the Dow Jones Industrial Average has extended its downturn, tagging two-month lows to conclude last week.
The downdraft punctuates a double top defined by the May and June peaks.
Tactically, overhead inflection points match the May low (33,473) and the 33,800 area.
A swift reversal atop resistance would preserve a range-bound posture, though against a still fragile June backdrop. The prevailing retest from underneath will likely add color.
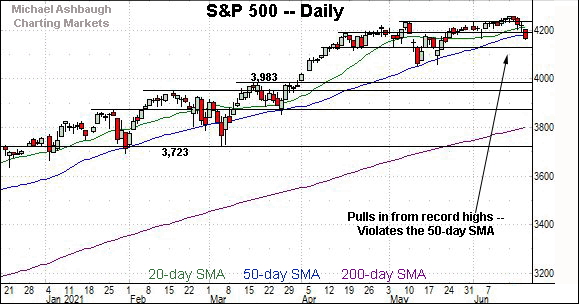
Meanwhile, the S&P 500’s backdrop splits the difference between that of the other two benchmarks.
Though last week’s close (4,166) matched notable support, it also registered slightly under the 50-day moving average, currently 4,183.
This marked just the third close under its 50-day since Nov. 4.
The bigger picture
As detailed above, the major U.S. benchmarks remain in divergence mode amid a backdrop that is not one-size-fits-all.
On a headline basis, the Dow Jones Industrial Average tagged two-month lows to conclude last week, extending a violation of its 50-day moving average.
Meanwhile, the Nasdaq Composite has held tightly to its range top, and remains within striking distance of record highs.
The S&P 500’s backdrop splits the difference between that of the other benchmarks. Last week’s close (4,166) registered within two points of notable support (4,168) — detailed repeatedly — and the index is back on offense with Monday’s strong start.
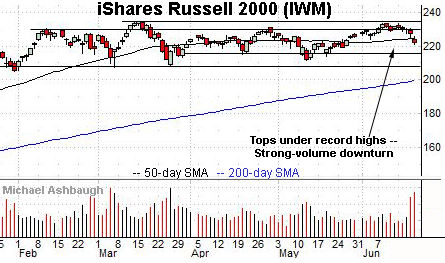
Moving to the small-caps, the iShares Russell 2000 ETF has pulled in from its range top amid a volume spike.
Still, its flatlining 50-day moving average, currently 224.30, is consistent with a range-bound backdrop.
Tactically, downside follow-through under the former range bottom (215.24) and the May low (211.54) would raise a caution flag.
Meanwhile, the SPDR S&P MidCap 400 ETF has tagged two-month lows as well as its lowest level of the second quarter.
Tactically, the former range top (489.50) and 50-day moving average, currently 494.60, mark overhead inflection points.
Placing a finer point on the S&P 500, the index has apparently maintained notable support (4,168) detailed repeatedly.
Last week’s close (4,166) registered nearby and the index is firmly higher early Monday.
Separately, it’s worth noting that Friday’s internals approached bearish extremes in spots. For instance, declining volume surpassed advancing volume by a 6-to-1 margin on the NYSE, and a comparably tame 2-to-1 margin on the Nasdaq.
As always, two 9-to-1 down days — across about a seven-session window — would reliably signal a major trend shift.
So collectively, the prevailing downturn does not exhibit the textbook traits of a major trend shift. Still, the downturn can accelerate, and Friday’s selling pressure registered as reasonably aggressive. (A 9-to-1 down day over the next week would cast recent selling pressure in a more bearish light.)
More broadly, the S&P 500 has registered what seems to be setting up as its third single-session close under the 50-day moving average since Nov. 4.
The prior two closing violations marked intermediate-term lows, punctuated by a resumption of the uptrend.
Separately, recall that last week’s close (4,166) roughly matched notable support (4,168). Monday’s early upturn punctuates a jagged, but successful, retest.
Delving deeper, the S&P’s former range bottom (4,118) is followed by likely last-ditch support matching the May low (4,056). An eventual violation would mark a material “lower low” — combined with the violation of the 50-day moving average — more firmly signaling an intermediate-term trend shift.
Beyond technical levels, market bulls might contend that last week’s downdraft marked an extra-strength two-day Fed-induced market whipsaw. Fed policy statements frequently trigger one- to two-day volatility spikes carrying limited lasting technical consequence.
Still, the downturn did inflict damage in spots, particularly to the financials, transports and industrials.
As it applies to the S&P 500, the index has maintained its first notable support. Its intermediate-term bias remains bullish, based on today’s backdrop, pending more aggressive downside follow-through.
Watch List
Drilling down further, consider the following sectors and individual names:
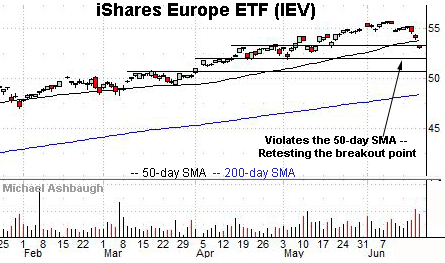
To start, the iShares Europe ETF has extended a pullback from 13-year highs.
Though the shares have violated the 50-day moving average — an area that has defined the trend — an extended retest of the breakout point (53.40) remains underway. Limited damage has thus far been inflicted in the broad sweep.
Tactically, the former range bottom (52.30) marks slightly deeper support. A sustained posture higher signals a bullish intermediate-term bias.
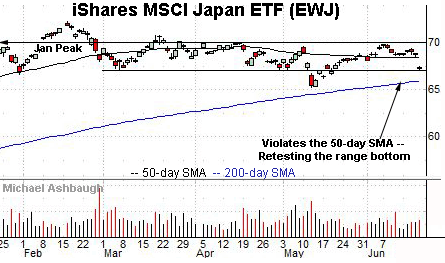
Meanwhile, the iShares MSCI Japan ETF has reached a notable technical test.
Specifically, the shares are pressing support matching a three-month range bottom (67.00). The prevailing downturn punctuates a failed test of the range top and subsequent violation of the 50-day moving average, currently 68.35.
Tactically, an eventual violation likely opens the path to a retest of the 200-day moving average, currently 65.98, and the May low (65.23).
Combined, the shares remain range-bound — based on today’s backdrop — though downside follow-through likely lays the groundwork for consequential technical tests not far from current levels.
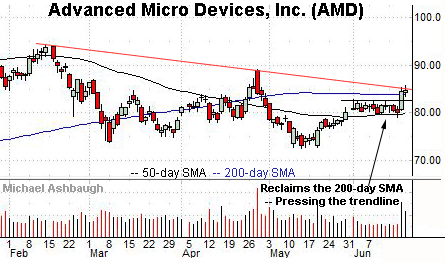
Moving to specific names, Advanced Micro Devices, Inc. is a large-cap semiconductor name coming to life.
Late last week, the shares reclaimed the 200-day moving average, rising after the company announced Google Cloud will offer cloud-based services based on AMD’s new chip.
The prevailing upturn punctuates a tight two-week range, placing trendline resistance under siege. Tactically, a breakout attempt is in play barring a violation of support in the 81.50-to-82.30 area.
More broadly, notice the developing double bottom defined by the March and May lows.
Atlassian Corp. is a large-cap Australia-based software vendor.
As illustrated, the shares have knifed to record highs, rising amid increased volume. The upturn punctuates a double bottom underpinned by the 200-day moving average on a closing basis.
Though near-term extended, the nearly straightline June spike is longer-term bullish. Tactically, the breakout point (258.40) is followed by the former range top (244.90).
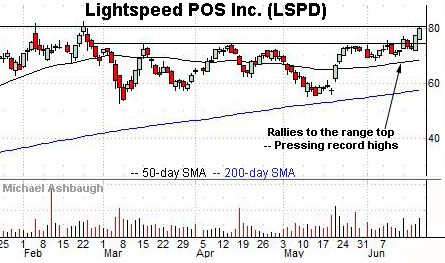
Public since August 2019, Lightspeed POS, Inc. is a large-cap Canada-based software vendor.
As illustrated, the shares are challenging record highs. The prevailing upturn punctuates a relatively tight early-June range.
Tactically, a breakout attempt is in play barring a violation of the former range top (74.60).


