Charting a bull-bear stalemate, Nasdaq hesitates at 50-day average
Focus: Currency trends confirmed to start second half of 2022, Energy sector challenges 200-day average, UUP, FXE, FXY, GLD, XLE
Technically speaking, the major U.S. benchmarks have registered a bull-bear stalemate, of sorts, to start the year’s second half.
Though each benchmark has sustained its recovery attempt, at least so far, the July upturn has been capped by two key levels — the S&P 500’s breakdown point (3,900) and the Nasdaq’s 50-day moving average.
Editor’s Note: As always, updates can be directly accessed at https://chartingmarkets.substack.com.
Before detailing the U.S. markets’ wider view, the S&P 500’s hourly chart highlights the past four weeks.
As illustrated, the S&P remains range-bound on this near-term view.
From current levels, the June gap (3,838) marks an inflection point detailed repeatedly. (Also see the daily chart.)
Tuesday’s early session low (3,837.9) has registered nearby.
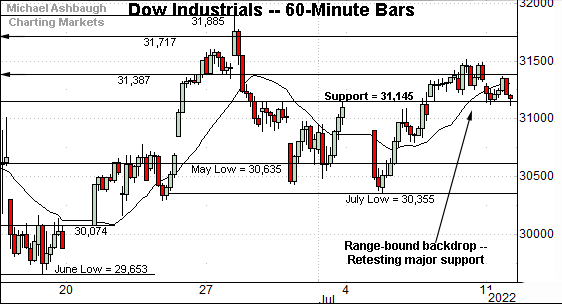
Similarly, the Dow Jones Industrial Average is traversing a familiar range.
Within the range, gap support (31,145) marks a downside inflection point, an area also detailed on the daily chart.
Against this backdrop, the Nasdaq Composite has diverged slightly.
Consider that its July upturn has tagged the range top (11,677) outpacing the other benchmarks.
The July peak (11,689), established Friday, registered within 12 points.
More immediately, the initial pullback from the range top has been underpinned by gap support (11,337).
Widening the view to six months adds perspective.
On this wider view, the Nasdaq has quietly approached a notable technical test. Two overhead inflection points stand out:
Resistance matching the range top (11,677), also detailed on the hourly chart.
The 50-day moving average, currently 11,607.
As always, the 50-day moving average is a widely-tracked intermediate-term trending indicator.
Upside follow-through atop the levels detailed would mark a “higher high” — combined with a rally atop the 50-day moving average — raising the flag to an intermediate-term trend shift.
So the 11,680 area marks a headline bull-bear battleground. The pending retest from underneath is worth tracking.
Conversely, the May low (11,035) marks a downside inflection point. The prevailing recovery attempt is intact barring a violation.
Looking elsewhere, the Dow Jones Industrial Average has rallied less aggressively from the June low.
Still, the index has sustained a slight break atop gap support (31,145), an area also detailed on the hourly chart.
On further strength, the 50-day moving average, currently 31,832, is followed by the late-June peak (31,885).
More distant overhead matches the February low (32,272) and gap resistance (32,267).
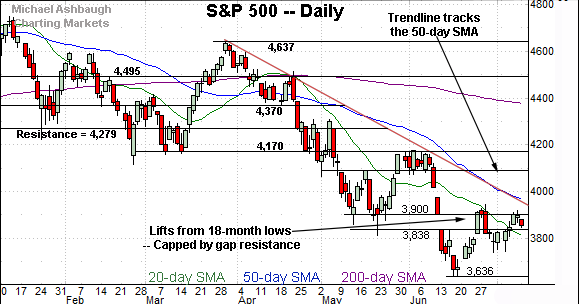
Meanwhile, the S&P 500 has thus far balked at major resistance.
Tactically, recall the breakdown point (3,900) marks a headline hurdle, matching the May closing low (3,900) and the top of the June gap (3,900).
Against this backdrop, the July closing high (3,902) — established Thursday — and last week’s close (3,899) have registered nearby.
The bigger picture
As detailed above, the major U.S. benchmarks have registered a bull-bear stalemate, of sorts, to start July, and the year’s second half.
On a positive note, each benchmark has sustained a lackluster July rally attempt, maintaining a posture in the upper half of its one-month range. (See the hourly charts.)
Still, the rally attempt has thus far stalled near two key levels.
The S&P 500 has balked at the 3,900 mark — a bull-bear inflection point detailed repeatedly — while the Nasdaq has topped near the 50-day moving average.
Follow-through atop these areas will be needed to extend the prevailing recovery attempt. (The prevailing upturn still gets relatively low marks for style, as measured by the internals, and related measurables.)
Moving to the small-caps, the iShares Russell 2000 ETF (IWM) has thus far sustained its recovery attempt, though amid a sluggish July start.
Tactically, follow-through atop the 50-day moving average, currently 177.60, and the late-June peak (178.15) would strengthen the bull case.
Conversely, the 169.35-to-169.80 area marks notable support.
Meanwhile, the SPDR S&P MidCap 400 ETF (MDY) continues to underperform the widely-tracked U.S. benchmarks.
As detailed previously, the breakdown point (424.30) marks an overhead hurdle.
Last week’s close (424.35) registered nearby, and modest selling pressure has surfaced.
Returning to the S&P 500, the index has started July amid a bull-bear stalemate.
Tactically, the S&P’s thus far lackluster recovery attempt is intact barring a violation of the 3,785-to-3,810 area. (The June close and May low.)
Charting overhead inflection points
Conversely, the June breakdown point (3,900) marks major resistance, detailed repeatedly. The July closing high (3,902) — established Thursday — and last week’s close (3,899) have registered nearby.
On further strength, trendline resistance closely tracks the 50-day moving average, currently 3,957.
The trendline is descending toward the one-month range top (3,945). (Also see the hourly chart.)
Against this backdrop, the prevailing bear-market rally attempt is intact.
Still, the S&P 500’s more important bigger-picture trends remain bearish. Eventual follow-through atop S&P 3,945, and trendline resistance, would be cause to reassess.
Watch List: Currency trends confirmed to start second half
Drilling down further, powerful 2022 currency trends have been confirmed to start July, and the year’s second half.
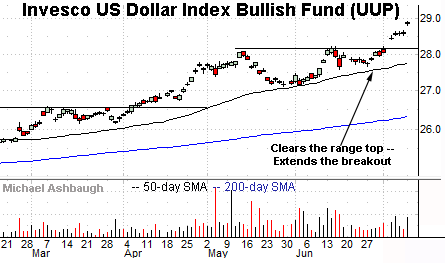
To start, the Invesco U.S. Dollar Bullish Fund (UUP) — a U.S. dollar proxy — continues to take flight, rising amid the Federal Reserve’s hawkish policy tilt versus other influential central banks.
The strong July start punctuates a bullish cup-and-handle defined by the May and late-June lows. As detailed previously, a near-term target projects to the 28.65 area.
Last week’s high (28.67) registered nearby, and the shares have extended the breakout this week.
Conversely, the breakout point (28.20) is followed by the ascending 50-day moving average. The dollar’s uptrend is firmly intact barring a violation.
Meanwhile, the Invesco Currency Shares Euro Trust (FXE) has extended to record lows.
The downturn punctuates consecutive failed tests of trendline resistance tracking the 50-day moving average.
More broadly, the breakdown punctuates a massive euro downtrend, hinged to the 2008 peak. (See the monthly chart.) Amid the downturn, the euro continues to approach parity with the U.S. dollar for the first time in 20 years.
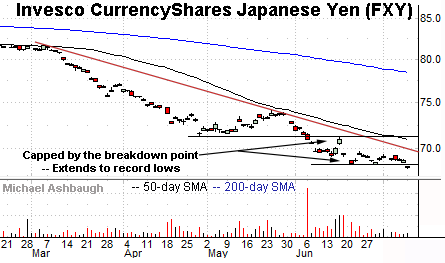
Similarly, the Invesco CurrencyShares Japanese Yen (FXY) has extended its downtrend.
Yen weakness has been fueled at least partly by the Bank of Japan’s dovish policy versus other central banks. Japan has experienced comparably low inflation coming out of the pandemic, contributing to its policy stance.
Tactically, trendline resistance roughly tracks the 50-day moving average.
More broadly, the shares have placed distance under major support — (the 2015 low) — illustrated on the monthly chart.
Fundamentally, U.S. dollar strength versus the euro and yen make U.S. exports comparably more expensive, a headwind for U.S. multinationals.
Looking elsewhere, the SPDR Gold Shares ETF (GLD) continues to trend lower. Gold and the U.S. dollar are inversely correlated.
Recall the prevailing downturn builds on the April trendline violation, and punctuates a failed test of resistance at the June peak.
Tactically, the breakdown point (168.30) pivots to resistance.
More broadly, recent weakness dovetails with a death cross — or bearish 50-day/200-day moving average crossover — an event that signaled last week. Though often a lagging indicator, the crossover signals the intermediate-term downtrend has overtaken the longer-term trend.
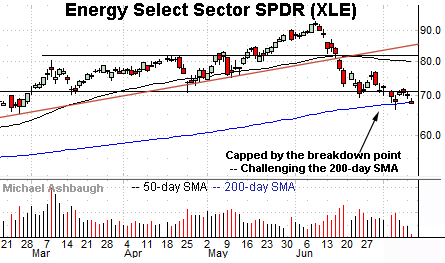
Finally, the Energy Select Sector SPDR (XLE) — profiled last week — remains tenuously positioned.
Technically, the group has struggled to reclaim its breakdown point (71.00), a bull-bear fulcrum, detailed previously.
Last week’s close (70.95) registered fractionally under resistance amid a failed retest from underneath.
More immediately, the prevailing downturn places the 200-day moving average, currently 68.18, under siege. As always, the 200-day is a widely-tracked longer-term trending indicator. A sustained violation of this area would raise a technical red flag.
Despite recent weakness, the energy sector remains the only U.S. sector posting a year-to-date gain.

