Charting the next upside targets: S&P 4,790 and Nasdaq 16,550
Focus: Semiconductor sector's breakout, Apple's strong-volume spike to record territory, SMH, AAPL, TJX, KBH, DDOG
U.S. stocks are mixed early Friday, vacillating amid still comfortably bullish November price action.
Against this backdrop, the S&P 500 and Nasdaq Composite are vying to conclude the week with technical breakouts, rising after each benchmark registered a nominal record close Thursday.
Editor’s Note: As always, updates can be directly accessed at chartingmarkets.substack.com.
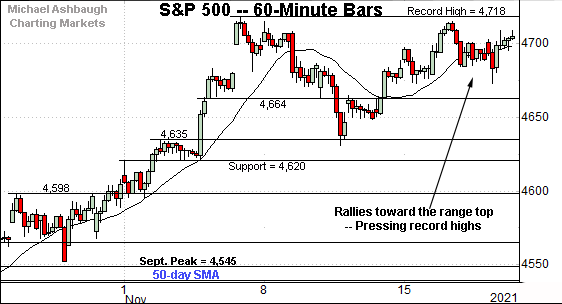
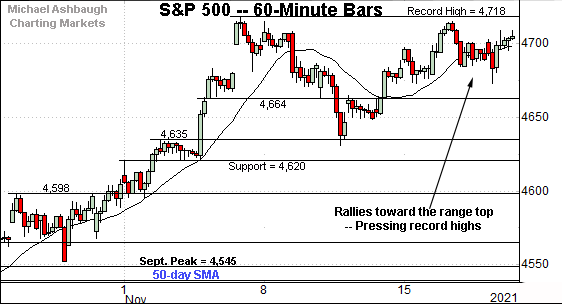
Before detailing the U.S. markets’ wider view, the S&P 500’s hourly chart highlights the past four weeks.
As illustrated, the S&P continues to press record territory.
In fact, Thursday’s close (4,704.5) marked a nominal record close, eclipsing the former record by less than three points.
The S&P’s absolute record peak (4,718.5) is increasingly within striking distance.
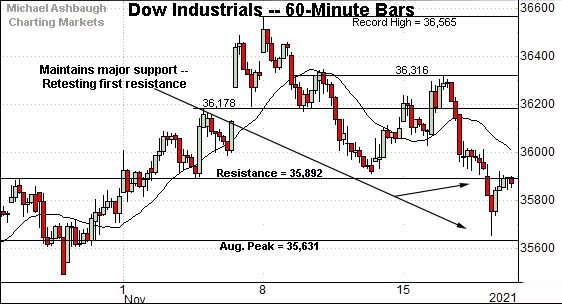
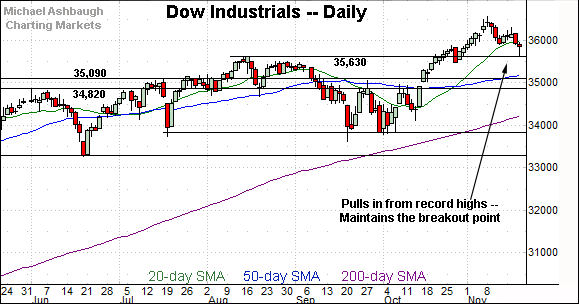
Meanwhile, the Dow Jones Industrial Average is not challenging record highs.
Instead, the index has pulled in toward its range bottom.
Tactically, major support matches the August peak (35,631) an area also detailed on the daily chart.
Conversely, the 35,890 area — detailed repeatedly — pivots to resistance.
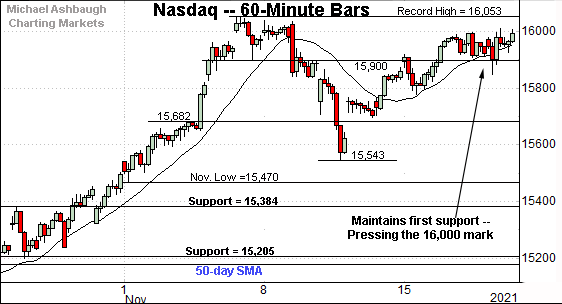
Against this backdrop, the Nasdaq Composite is pressing the 16,000 mark.
Here again, Thursday’s close (15,993) marked a nominal record close, eclipsing the former record by about nine points.
Tactically, the prevailing upturn punctuates a successful test of the 15,900 area.
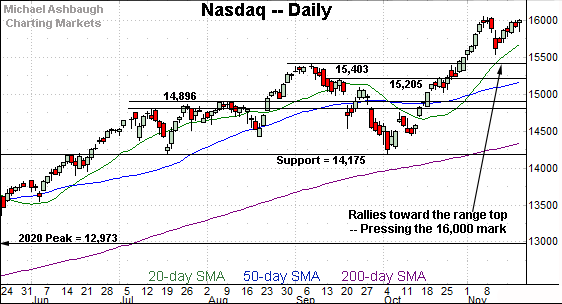
Widening the view to six months adds perspective.
On this wider view, the Nasdaq continues to challenge record highs, as it vies Friday for its first close atop the 16,000 mark.
As detailed repeatedly, an intermediate-term target projects to the 16,550 area. (See the Oct. 27 review.)
Notably, the Nasdaq’s near-term target projects from the November range to 16,563, closely matching its intermediate-term target.
(Start with the record high, and subtract the post-breakout low: 16,053 - 15,543 = 510 points. Then, add the result to the record high: 16,053 + 510 = 16,563.)
Looking elsewhere, the Dow Jones Industrial Average has extended its pullback from record territory.
The downturn has been underpinned by the breakout point (35,630), a level defining the Dow’s first significant support.
Thursday’s session low (35,654) registered slightly above support amid a successful retest. (See Thursday’s bullish reversal — a dragonfly doji — and close near session highs.)
Delving deeper, the 50-day moving average, currently 35,200, is followed by the May peak (35,091). The Dow’s intermediate-term bias remains bullish barring a violation of this area.
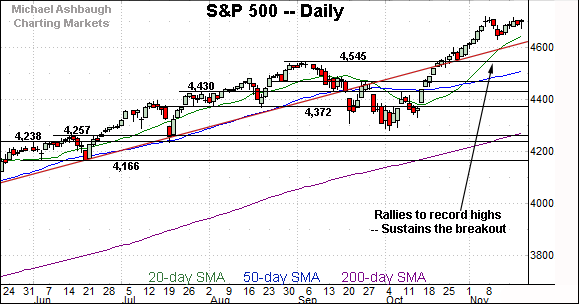
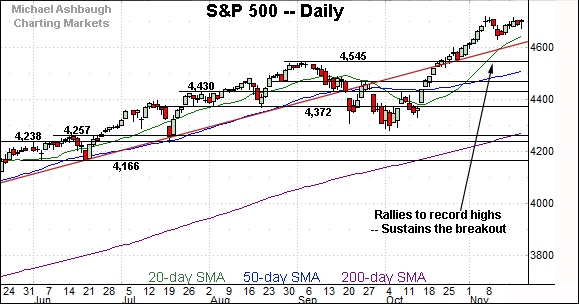
Meanwhile, the S&P 500 continues to hold its range top.
The prevailing bull flag — the tight mid-November range, hinged to the previously steep rally — is a bullish continuation pattern.
The bigger picture
As detailed above, the major U.S. benchmarks have diverged slightly — each index is doing different things — though the bigger-picture backdrop remains comfortably bullish.
On a headline basis, the S&P 500 and Nasdaq Composite have registered nominal record closes amid breakout attempts that remain underway.
Meanwhile, the Dow Jones Industrial Average has pulled in from record highs, though its downturn has been underpinned by major support. (See the daily chart.)
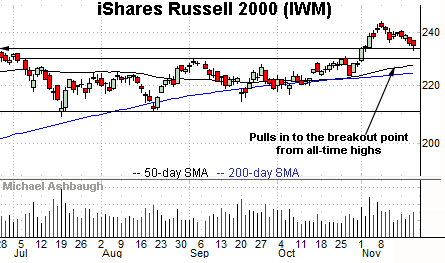
Moving to the small-caps, the iShares Russell 2000 ETF has extended a pullback from recent record highs.
Tactically, the downturn has thus far been underpinned by the breakout point (234.50).
Thursday’s close (234.86) registered slightly higher.
On further weakness, deeper support matches the former range top (229.80).
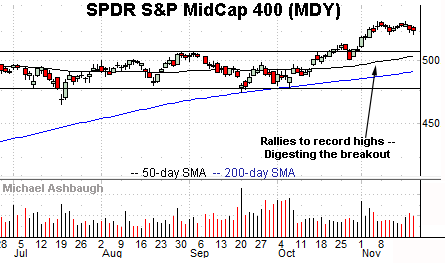
Meanwhile, the SPDR S&P MidCap 400 ETF remains comparably stronger than the Russell 2000.
The MDY’s unusually tight November range is a bullish continuation pattern.
Placing a finer point on the S&P 500, the index is holding its range top.
The prevailing upturn punctuates a relatively shallow pullback, underpinned by near-term support — the 4,620-to-4,635 area.
More immediately, recent persistence near the 4,700 mark signals still muted selling pressure, laying the groundwork for potential follow-through.
On further strength, an intermediate-term target projects to the 4,775-to-4,790 area, detailed repeatedly.
Returning to the six-month view, the S&P 500’s bigger-picture backdrop remains straightforward.
Tactically, the post-breakout low (4,630) is closely followed by trendline support, circa 4,615.
Delving deeper, the breakout point (4,545) remains a more important floor. Broadly speaking, the S&P 500’s intermediate-term bias remains bullish barring a violation of the 4,540 area.
Watch List
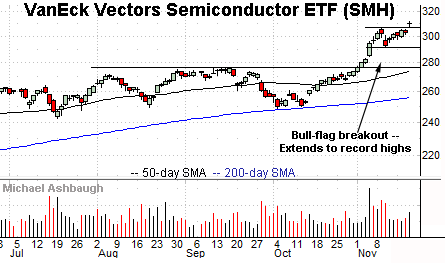
Drilling down further, the VanEck Vectors Semiconductor ETF — most recently profiled Nov. 3 — is acting well technically.
The group started November with a breakout, knifing to record highs. The nearly straightline spike punctuated a double bottom defined by the August and October lows. (See the successful test of the 200-day moving average at the October low.)
More immediately, the prevailing upside follow-through punctuates a flag-like pattern amid increased volume.
Tactically, the breakout point (305.95) is followed by the former range bottom (291.55). A sustained posture higher signals a firmly-bullish bias.
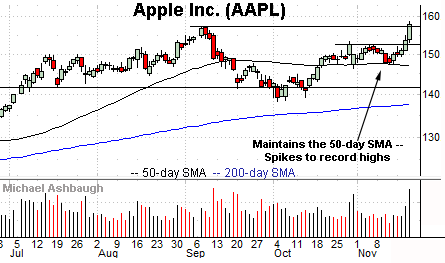
Moving to specific names, Apple, Inc. is a large-cap name taking flight.
Technically, the shares have knifed to record highs, rising amid reports the company’s electric vehicle could be launched as soon as 2025.
The strong-volume spike punctuates a tight three-week range, underpinned by the 50-day moving average. Tactically, a near-term target projects from the former range to the 160 area. (About 159.95, to be precise.)
Conversely, the breakout point (156.70) is followed by the former range top (152.60).
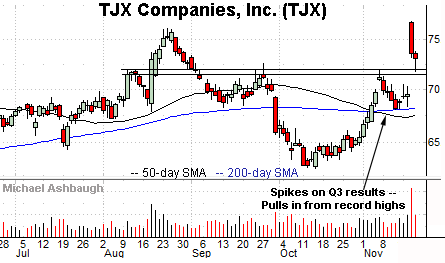
TJX Companies, Inc. is a large-cap retailer coming to life. (Yield = 1.4%.)
Earlier this week, the shares gapped sharply higher, briefly tagging record highs after the company’s third-quarter results.
The subsequent pullback places the shares 5.3% under the November peak.
Tactically, gap support (71.80) is followed by the firmer breakout point (71.20). The prevailing rally attempt is intact barring a violation.
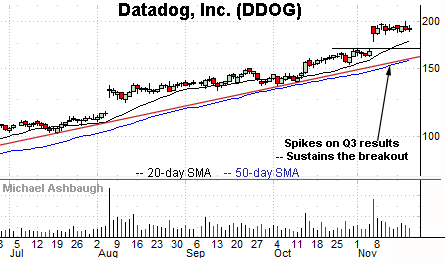
Public since September 2019, Datadog, Inc. is a large-cap monitoring and analytics services provider.
Earlier this month, the shares gapped to record highs, rising after the company’s strong quarterly results. The subsequent flag pattern has formed amid decreased volume, laying the groundwork for potential follow-through.
Tactically, near-term support (184.80) is followed by the top of the gap (177.50). A sustained posture higher signals a firmly-bullish bias.
Delving deeper, trendline support tracks the 50-day moving average, and is rising toward the bottom of the gap.
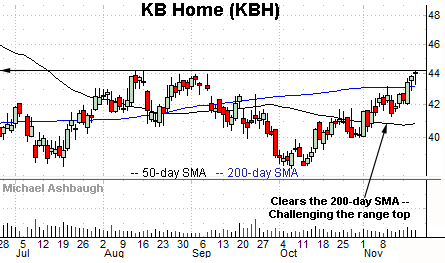
Finally, KB Home is a mid-cap homebuilder showing signs of life.
Technically, the shares have reclaimed the 200-day moving average, rising to challenge five-month highs.
Underlying the upturn, its relative strength index (not illustrated) has tagged its best levels since February, improving the chances of an eventual breakout.
Tactically, a breakout attempt is in play barring a closing violation of the 200-day moving average, currently 43.16.
More broadly, the prevailing upturn punctuates a double bottom — defined by the July and October lows — laying the groundwork for potentially swift follow-through on a breakout.


