Charting a stealth breakout attempt: Nasdaq approaches record territory
Focus: Oil & Gas Exploration ETF sustains technical breakout, Netflix takes flight, XOP, NFLX, STX, AXP, M
U.S. stocks are mixed early Wednesday, vacillating after a generally strong batch of influential earnings reports.
Against this backdrop, the S&P 500 and Dow industrials have sustained recent slow-motion breaks to record territory.
Elsewhere, the Nasdaq Composite has thus far topped slightly under record highs, though amid a backdrop that seems to be setting up well for potentially consequential follow-through.
Editor’s Note: As always, updates can be directly accessed at chartingmarkets.substack.com.
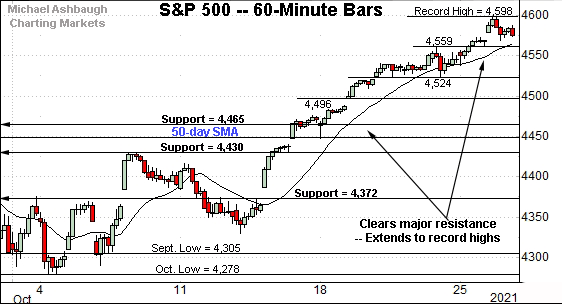
Before detailing the U.S. markets’ wider view, the S&P 500’s hourly chart highlights the past four weeks.
As illustrated, the S&P has extended a persistent break to record territory.
The week-to-date peak (4,598) has registered just under the 4,600 mark.
From current levels, near-term inflection points — at 4,559 and 4,524 — are followed by deeper gap support (4,496).
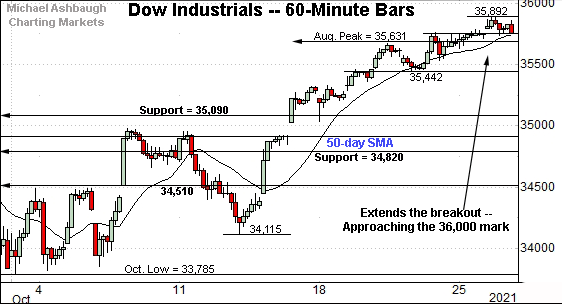
Similarly, the Dow Jones Industrial Average has tagged its latest record high.
Tactically, recall the August peak (35,631) — formerly the Dow’s all-time high — is followed by the Dow’s post-breakout low (35,442).
Wednesday’s early session low (35,624) registered near the former.
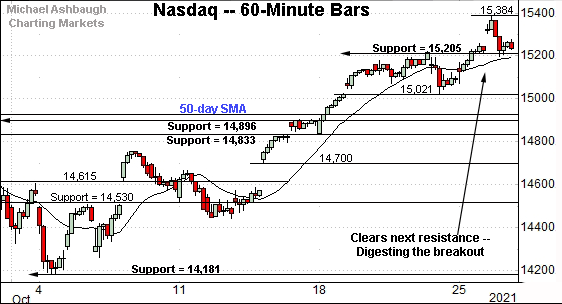
Against this backdrop, the Nasdaq Composite is digesting a break to one-month highs.
The prevailing upturn punctuates a flag pattern — the tight one-week range — underpinned by the former range bottom (15,021).
Delving deeper, the 50-day moving average, currently 14,929, is closely followed by major support (14,896) also illustrated below.
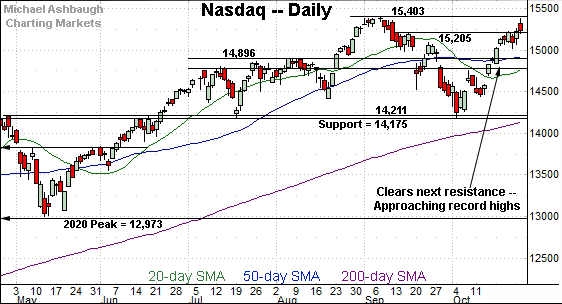
Widening the view to six months adds perspective.
On this wider view, the Nasdaq has extended its rally attempt, rising firmly within view of its record high (15,403).
The week-to-date peak (15,384) has missed a new record by 19 points.
On further strength, an intermediate-term target projects from the October low to the 16,550 area. The pending retest of the range top should be a useful bull-bear gauge.
More broadly, recall the October low (14,181) matched genuinely major support (14,175) a level defining the Nasdaq’s former double bottom. The prevailing straightline rally also builds on the July low (14,178) laying the groundwork for potentially swift upside follow-through.
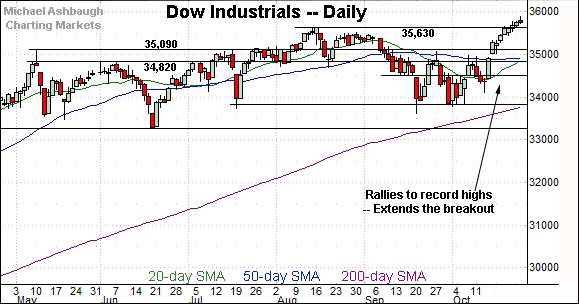
Looking elsewhere, the Dow Jones Industrial Average has extended a lukewarm break to record territory.
Still, recent follow-through builds on the Dow’s initially decisive rally atop the 50-day moving average. Recall three of four closes registered atop the 20-day volatility bands amid a bullish two standard deviation breakout.
From current levels, first support matches the breakout point (35,631).
Wednesday’s early session low (35,624) registered nearby.
Delving deeper, a familiar inflection point closely matches the May peak (35,091). (Also see the hourly chart.)
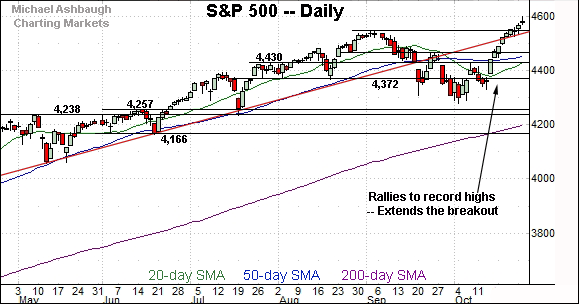
Similarly, the S&P 500 has extended its break to record territory.
Tactically, the breakout point (4,545) closely matches trendline support.
The bigger picture
Collectively, the major U.S. benchmarks continue to trend higher amid slightly uneven, but still largely rotational, market price action.
On a headline basis, the S&P 500 and Dow industrials have extended modest late-month breaks to record territory.
Meanwhile, the Nasdaq Composite is digesting a break to just one-month highs, though its backdrop seems to be setting up well for potentially consequential follow-through.
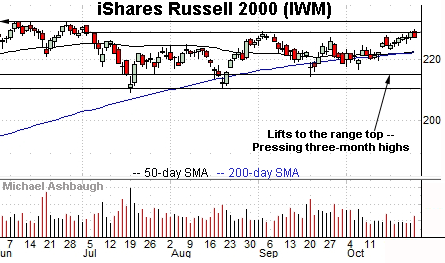
Moving to the small-caps, the iShares Russell 2000 ETF is pressing familiar resistance.
Overhead inflection points match the three-month range top (229.84) and the week-to-date peak (230.72).
Elsewhere, the SPDR S&P MidCap 400 ETF has sustained a modest break to record territory.
Tactically, the breakout point — the 506.00-to-507.60 area — pivots to support. A retest is underway early Wednesday.
More broadly, the MDY is rising from a prolonged five-month base, laying the groundwork for potentially material upside follow-through.
Placing a finer point on the S&P 500, the index has reached record territory, thus far topping just under the 4,600 mark.
Slightly more broadly, the S&P has trended atop its 20-hour moving average following a mid-month rally its former breakdown point (4,372). The hallmark of a strong near-term uptrend.
Returning to the six-month view, the S&P 500 has extended a slow-motion October breakout.
The breakout point — defined by the September peak (4,545) — pivots to notable support.
Delving deeper, three familiar inflection points stand out: The late-September peak (4,465), the 50-day moving average, and the 4,430 mark.
Tactically, the S&P 500’s intermediate-term bias remains bullish barring a violation of this area.
On further strength, an intermediate-term target projects from the October low to the 4,775-to-4,790 area, as detailed previously.
Watch List
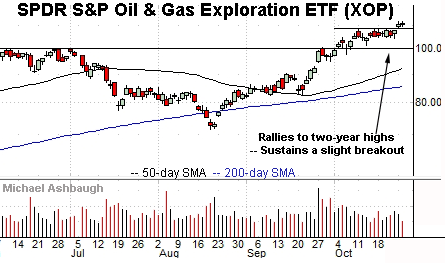
Drilling down further, the SPDR S&P Oil & Gas Exploration and Production ETF is acting well technically. (Yield = 1.3%.)
As illustrated, the group has tagged two-year highs, rising from a relatively tight October range. (A bullish continuation pattern.)
More broadly, the prevailing upturn originates from a successful test of the 50-day moving average at the late-September low.
Tactically, the breakout point (107.60) is followed by the group’s former range top, circa 100. The 50-day moving average is rising toward the latter. A sustained posture atop this area signals a bullish bias.
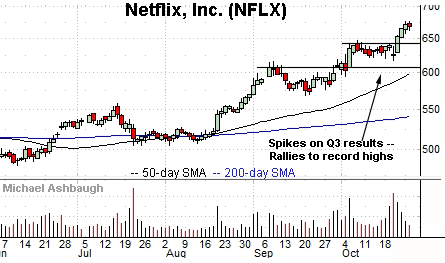
Netflix, Inc. is a large-cap name taking flight.
As illustrated, the shares have knifed to all-time highs, rising sharply after the company’s strong third-quarter results.
Though near-term extended, and due to consolidate, the sustained strong-volume spike is longer-term bullish. A pullback toward the breakout point, circa 642, would be expected to draw buyers.
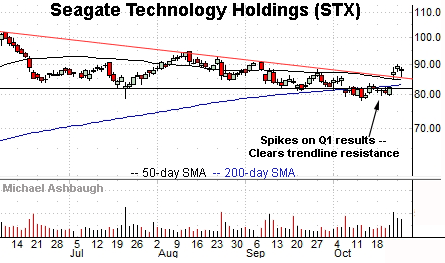
Seagate Technology Holdings is a large-cap name coming to life.
Technically, the shares have recently gapped atop trendline resistance — and the 50-day moving average — rising after the company’s strong quarterly results.
The subsequent pullback has been flat, underpinned by the trendline, positioning the shares to build on the initial spike.
Tactically, the top of the gap (85.10) closely matches the 50-day moving average, currently 84.80. The prevailing rally attempt is intact barring a violation.
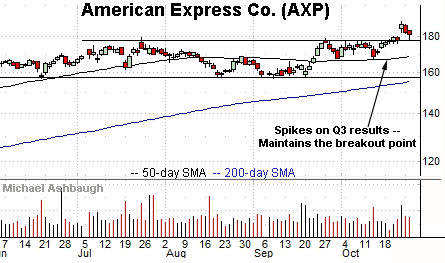
American Express Co. is a Dow 30 component positioned to rise.
Late last week, the shares knifed to record territory, rising after the company’s third-quarter results.
By comparison, the immediate pullback has been flat, and underpinned by the breakout point, circa 176.80.
Delving deeper, the ascending 50-day moving average, currently 168.90, has marked a bull-bear inflection point. A sustained posture higher signals a bullish bias.
Finally, Macy’s, Inc. is a well positioned large-cap retailer. (Yield = 2.3%.)
Earlier this month, the shares knifed to 33-month highs, rising after an analyst upgrade to hold from sell.
The ensuing flag-like pattern has formed amid decreased volume, positioning the shares to build on the initial strong-volume spike.
Tactically, the breakout point pivots to support — the 25.10-to-25.50 area — and prevailing rally attempt is intact barring a violation.


