S&P 500 holds trendline support amid market rotation
Focus: Regional banks consolidate October breakout, Spotify and Plug Power take flight amid breaks atop 200-day average, KRE, SPOT, FTNT, TDOC, PLUG
U.S. stocks are mixed early Friday, vacillating after disappointing earnings reports from Apple and Amazon.
Against this backdrop, the each big three U.S. benchmark has tagged record highs this week, rising amid still rotational (and bullish) market price action. The best six months seasonally — November through April — kick off Monday.
Editor’s Note: As always, updates can be directly accessed at chartingmarkets.substack.com.
Before detailing the U.S. markets’ wider view, the S&P 500’s hourly chart highlights the past four weeks.
As illustrated, the S&P has sustained an early-week break to record territory.
The week-to-date peaks — Tuesday (4,598.5) and Thursday (4,597.6) — have registered just under the 4,600 mark.
Conversely, the post-breakout low (4,551) has registered slightly above the S&P’s breakout point (4,545) an area better illustrated on the daily chart.
Meanwhile, the Dow Jones Industrial Average is holding its range top.
Tactically, recall the August peak (35,631) — formerly the Dow’s all-time high — is followed by the Dow’s post-breakout low (35,442).
Friday’s early session low (35,633) effectively matched the former.
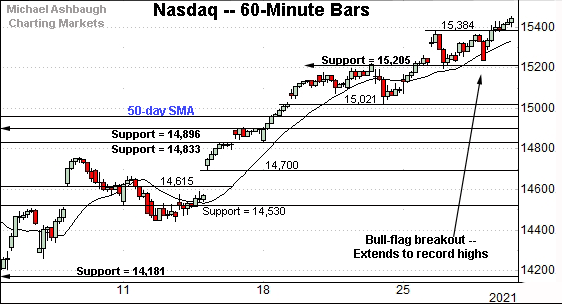
Against this backdrop, the Nasdaq Composite has belatedly reached all-time highs.
The prevailing upturn punctuates a bull flag underpinned by major support (15,205).
Delving slightly deeper, recall the prior flag pattern, underpinned by the former range bottom (15,021).
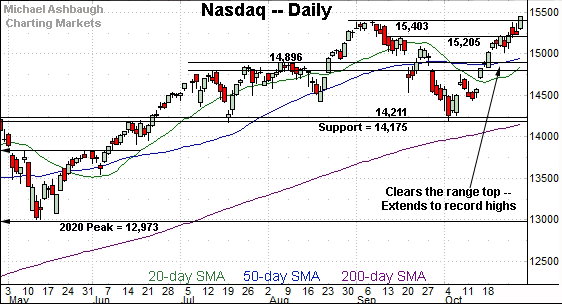
Widening the view to six months adds perspective.
On this wider view, the Nasdaq has cleared its range top, edging to record highs.
Tactically, the breakout point (15,403) pivots to first support.
Conversely, an intermediate-term target projects to the 16,550 area from the October low.
(Recall the October low (14,181) matched major support (14,175) a level formerly defining the Nasdaq’s bullish double bottom.)
Looking elsewhere, the Dow Jones Industrial Average is holding its range top.
Against this backdrop, the Dow’s breakout point (35,631) — detailed previously — marks its first notable floor. (See Wednesday’s review.)
Friday’s early session low (35,633) has registered within two points.
More broadly, this week’s flattish price action punctuates the Dow’s decisive mid-October breakout. Recall three of four closes registered atop the 20-day volatility bands amid a powerful two standard deviation breakout.
Bullish price action.
Meanwhile, the S&P 500 has sustained an early-week break to record territory.
Tactically, the mid-week low (4,551) has registered slightly above the S&P’s breakout point (4,545), an area roughly matching trendline support. Constructive price action.
The bigger picture
As detailed above, the major U.S. benchmarks are concluding October on a bullish note.
On a headline basis, each big three benchmark has tagged record highs this week, rising amid uneven, but still largely rotational, sub-sector price action.
Against this backdrop, the best six months seasonally — November through April — begin Monday.
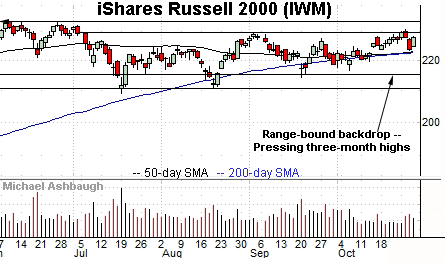
Moving to the small-caps, the iShares Russell 2000 ETF remains range-bound.
To reiterate, overhead inflection points match the three-month range top (229.84) and the October peak (230.72).
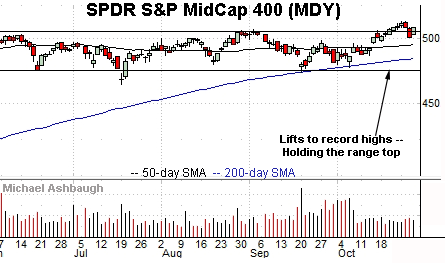
Elsewhere, the SPDR S&P MidCap 400 ETF is vying to sustain its October breakout.
Recall the prevailing upturn punctuates a prolonged base, laying the groundwork for potentially material upside follow-through.
Placing a finer point on the S&P 500, the index has asserted consecutive flag patterns in record territory.
Put differently, last week’s tight range — underpinned by the 4,524 support — has been punctuated by this week’s relatively tight range, signaling still muted selling pressure in previously uncharted territory.
(On a granular note, the prevailing upturn has been underpinned by the 20-hour moving average with the exception of Wednesday’s brief final-hour shakeout.)
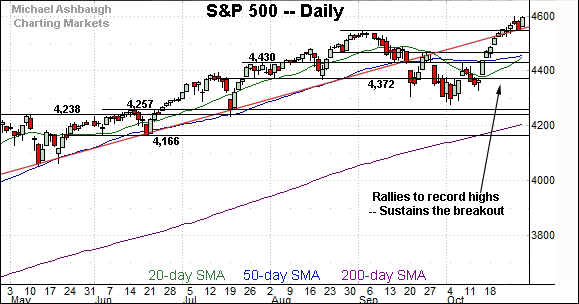
Returning to the six-month view, the S&P 500 has sustained its late-October breakout.
The modest mid-week pullback has been underpinned by trendline support and the breakout point (4,545).
Delving deeper, familiar inflection points fall out as follows: The late-September peak (4,465), the 50-day moving average, and the 4,430 mark.
As detailed repeatedly, the S&P 500’s intermediate-term bias remains bullish barring a violation of the 4,430 area.
On further strength, an intermediate-term target continues to project from the October low to the 4,775-to-4,790 area.
Watch List
Drilling down further, the SPDR S&P Regional Banking ETF is acting relatively well technically. (Yield = 2.1%.)
To be sure, the group has violated its breakout point, pulling in amid increased volume from recent record highs.
But more broadly, the slow-motion October uptrend punctuates a double bottom — the W formation — defined by the July and September lows.
Tactically, the 50- and 200-day moving averages are rising toward the former breakout point (67.00). A sustained posture higher signals a bullish bias.
Spotify Technology is a large-cap Luxembourg-based provider of audio-streaming services.
Technically, the shares have tagged six-month highs, knifing atop the 200-day moving average after the company’s quarterly results. The prevailing upturn punctuates a cup-and-handle defined by the August and September lows.
Though near-term extended, the sustained strong-volume spike is longer-term bullish. Tactically, the breakout point (275.60) is followed by the former range top (263.60).
Fortinet, Inc. is a well positioned large-cap cybersecurity name.
Earlier this month, the shares rallied to all-time highs, clearing resistance matching the August peak.
The upturn punctuates an orderly 10-week range —a bullish continuation pattern — hinged to the early-August strong-volume spike.
More immediately, the prevailing pullback places the shares near the breakout point (320.00) and 5.5% under the October peak.
Note the company’s quarterly results are due out Nov. 4.
Teladoc Health, Inc. is a large-cap provider of virtual health services.
As illustrated, the shares have staged a massive bullish reversal — a bullish engulfing pattern — rising from trendline support after the company’s third-quarter results.
The strong-volume spike places the shares at two-month highs, and atop the 100-day moving average for the first time since March.
Tactically, the prevailing rally attempt is intact barring a violation of the breakout point (143.10).
Finally, Plug Power, Inc. is a large-cap developer of hydrogen fuel cell solutions.
As illustrated, the shares have knifed to seven-month highs, clearing the 200-day moving average after an analyst upgrade.
The prevailing upturn positions the shares to build on the steep early-October strong-volume rally.
Tactically, the breakout point (35.00) is closely followed by the 200-day moving average, currently 34.40. A sustained posture atop this area signals a firmly-bullish bias.


