Bull trend confirmed: Major U.S. benchmarks tag record highs
Focus: Semiconductor sector breaks to record territory, Russell 2000's two standard deviation breakout, SMH, AMD, STM, FFIV, LCID
U.S. stocks are mixed midday Wednesday, vacillating ahead of the Federal Reserve’s latest policy statement, due out this afternoon.
Against this backdrop, each big three U.S. benchmark is digesting its latest break to record territory.
Editor’s Note: As always, updates can be directly accessed at chartingmarkets.substack.com.
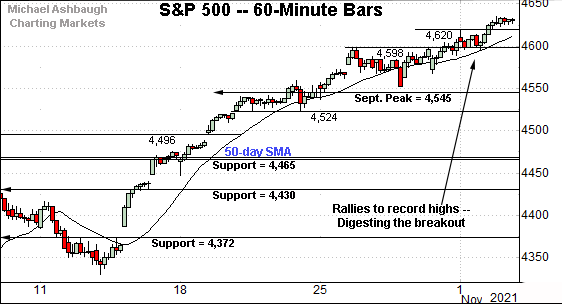
Before detailing the U.S. markets’ wider view, the S&P 500’s hourly chart highlights the past four weeks.
As illustrated, the S&P has extended its rally to record territory, grinding atop the 4,600 mark to start November.
Tactically, near-term support (4,620) is followed by the 4,600 area, and a much firmer floor matching the September peak (4,545).
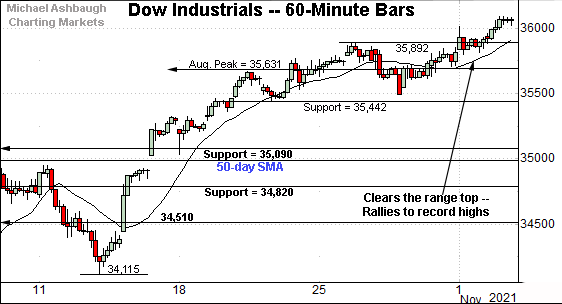
Meanwhile, the Dow Jones Industrial Average has cleared the 36,000 mark for the first time on record.
Tactically, the breakout point (35,890) is followed by an inflection point matching the August peak (35,631), an area better illustrated on the daily chart.
Against this backdrop, the Nasdaq Composite has also extended to record highs.
Tactically, the November low (15,470) is followed by the breakout point, an area broadly spanning from about 15,384 to 15,403. (Also see the daily chart below.)
Widening the view to six months adds perspective.
On this wider view, the Nasdaq has extended its break to record territory.
Tactically, an intermediate-term target continues to project to the 16,550 area, detailed previously.
Conversely, the breakout point (15,403) is followed by the former range top (15,205).
More broadly, recall the October low (14,181) matched major support (14,175) a level formerly defining the Nasdaq’s bullish double bottom.
Looking elsewhere, the Dow Jones Industrial Average has also extended to record highs.
In the process, the index has registered its first-ever close atop the 36,000 mark.
(The marquee 40,000 mark rests 11.11% above the 36,000 mark.)
Technically, the November upturn marks the “expected” follow-through on the Dow’s steep mid-October spike. Recall three of four closes registered atop the 20-day volatility bands amid a powerful two standard deviation breakout.
(The “expected” price action pertains to steep mid-October rally, subsequent sideways chop, and upside follow-through, building on the initial spike.)
Similarly, the S&P 500 has extended a persistent break to record territory.
Tactically, trendline support is closely followed by the breakout point (4,545).
The bigger picture
As detailed above, the major U.S. benchmarks are acting well technically.
On a headline basis, each big three benchmark has concurrently tagged record highs to start November.
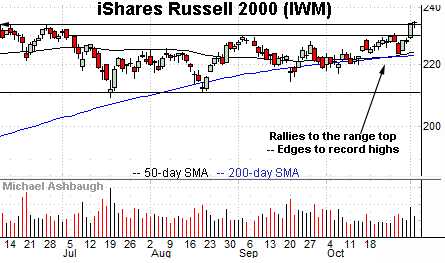
Moving to the small-caps, the iShares Russell 2000 ETF has finally come to life, rising to tag record highs.
Notably, the prevailing upturn marks an unusually strong two standard deviation breakout, encompassing consecutive closes atop the 20-day Bollinger bands.
Tactically, the slight breakout punctuates a prolonged range, opening the path to potentially material longer-term follow-through. (The longer the base, the higher the space.)
Elsewhere, the SPDR S&P MidCap 400 ETF has extended the break from its former range.
Combined, the small- and mid-cap benchmarks have both started November with strong-volume breakouts.
Placing a finer point on the S&P 500, the index continues to trend higher.
In fact, the S&P has largely trended atop its 20-hour moving average across about three weeks. (Going back to the spike back atop the 4,372 inflection point.)
Put differently, a strong near-term uptrend is in play as a seasonally favorable phase kicks off.
More broadly, the S&P 500’s six-month view remains straightforward.
Tactically, trendline support is closely followed by the breakout point (4,545).
Delving deeper, more important support matches the 50-day moving average, currently 4,468, the late-September peak (4,465) and the 4,430 mark.
As detailed repeatedly, the S&P 500’s intermediate-term bias remains bullish barring a violation of the 4,430 area.
Conversely, an intermediate-term target projects to the 4,775-to-4,790 area — detailed previously — or about 3.1% to 3.4% above current levels.
Watch List
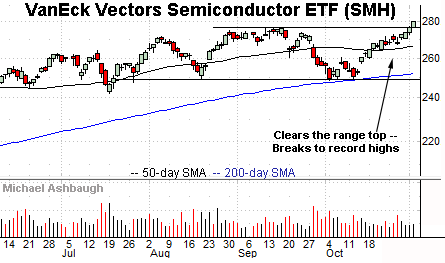
Drilling down further, the VanEck Vectors Semiconductor ETF is acting well technically.
As illustrated, the group has started November with a break to record highs, clearing resistance matching the September peak. The prevailing upturn originates from a successful test of the 200-day moving average.
Tactically, an intermediate-term target projects to the 302 area.
Conversely, the breakout point (276.50) pivots to first support and is followed by a near-term floor, circa 272.70.
Moving to specific names, Advanced Micro Devices, Inc. is a well positioned large-cap semiconductor name.
Late last month, the shares reached record highs, rising amid a volume spike after the company’s quarterly results.
The subsequent flag pattern has been punctuated by upside follow-through.
Tactically, the former range top (122.50) is followed by the firmer breakout point (118.80). A sustained posture higher signals a bullish bias.
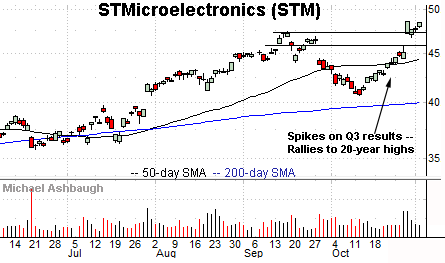
STMicroelctronics N.V. is a large-cap Switzerland-based semiconductor name.
As illustrated, the shares have recently gapped to 20-year highs, rising after the company’s third-quarter results.
The subsequent pullback has been comparably flat — fueled by decreased volume — positioning the shares to build on the initial spike.
Tactically, the prevailing rally attempt is intact barring a violation of the post-breakout low (46.75) and slightly deeper gap support (45.80).
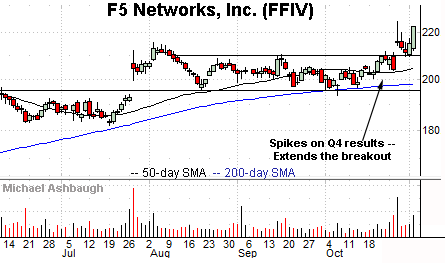
F5 Networks, Inc. is a well positioned large-cap name.
Late last month, the shares knifed to record highs, rising after the company’s fourth-quarter results.
The subsequent pullback has filled the gap, and been punctuated by upside follow-through. Tactically, initial support (216.25) is followed by the breakout point (209.60).
More broadly, the shares are well positioned on the two-year chart, rising from a prolonged inverse head-and-shoulders pattern.
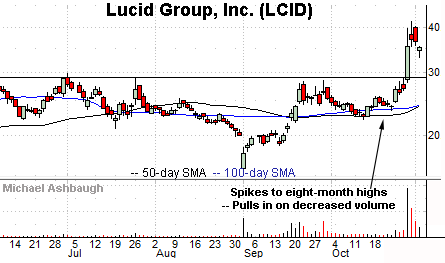
Public since September 2020, Lucid Group, Inc. is a large-cap electric vehicle manufacturer.
Technically, the shares have recently knifed to eight-month highs, rising after the company announced plans to deliver the first of its luxury electric cars.
The subsequent pullback places the shares 18.4% under the October peak.
Tactically, the early-November low (33.02) has been punctuated by a bull hammer — (the long-tailed single-day bullish reversal) — and offers an area to work against. A sustained posture higher signals a bullish bias.
More broadly, the prevailing breakout punctuates a head-and-shoulders bottom defined by the July, September and October lows.


