Charting a sluggish September start: Dow industrials challenge 50-day average
Focus: 10-year yield reaches major test, Japan takes flight, Netflix and Facebook tag record close, TNX, EWJ, NFLX, FB, NVAX, WSM
U.S. stocks are lower early Wednesday, pressured at least partly amid lingering concerns over last week’s much weaker-than-expected monthly U.S. jobs report.
Against this backdrop, the S&P 500 and Nasdaq Composite have pulled in from recent record highs, pressured amid a downturn that has inflicted limited, if any, technical damage.
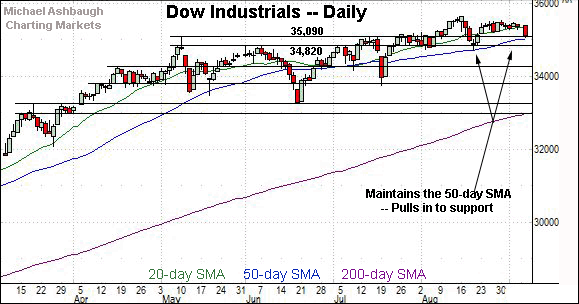
Elsewhere, the Dow Jones Industrial Average continues to diverge, pulling in to challenge its 50-day moving average, currently 35,022.
Editor’s Note: As always, updates can be directly accessed at chartingmarkets.substack.com.
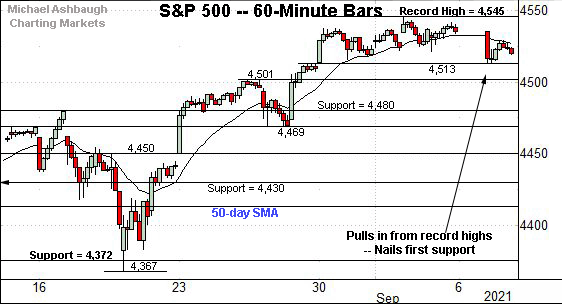
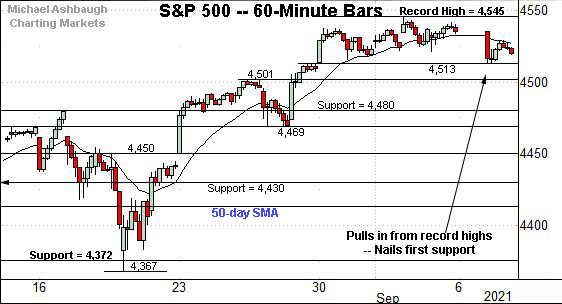
Before detailing the U.S. markets’ wider view, the S&P 500’s hourly chart highlights the past four weeks.
As illustrated, the S&P is digesting its latest break to record territory.
The prevailing pullback has been underpinned by first support (4,513), detailed previously.
Tuesday’s session low (4,513.00) precisely matched support.
Meanwhile, the Dow Jones Industrial Average remains range-bound.
Consider that near-term resistance (35,510) has capped the index across about three weeks.
More immediately, the Dow has challenged support matching the May peak (35,091) to start this week.
Delving deeper, the 50-day moving average, currently 35,022, is followed by the 34,820 area. A retest of the 50-day is already underway early Wednesday.
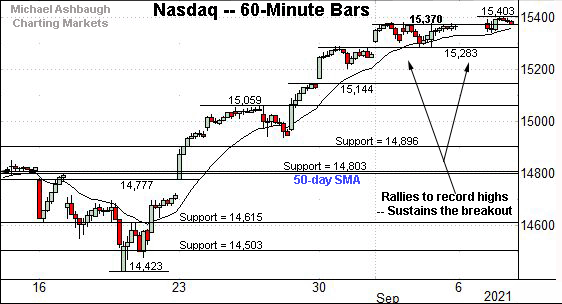
True to recent form, the Nasdaq Composite remains the strongest major benchmark.
As illustrated, the index has reached its near-term target of 15,370, detailed repeatedly. (See the Aug. 23 review, and subsequent reviews.)
The Nasdaq’s record close (15,374), established Tuesday, registered nearby.
Conversely, the prevailing range bottom (15,283) is followed by gap support (15,144).
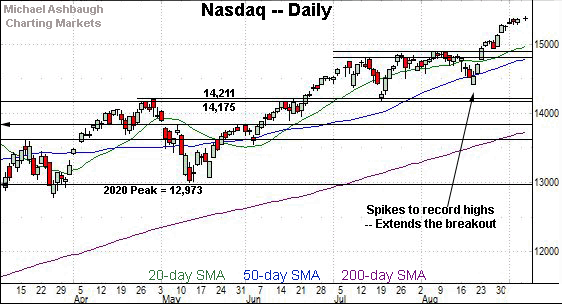
Widening the view to six months adds perspective.
On this wider view, the Nasdaq is digesting a decisive break to record territory.
The late-August spike marked a two standard deviation breakout — encompassing consecutive closes atop the 20-day Bollinger bands — and has been punctuated by grinding-higher follow-through.
On further strength, a slightly more distant target continues to project from the July range to the 15,420 area. (See the July 30 review and June 23 review.)
The September peak (15,403) — also the Nasdaq’s all-time high — has registered within view of the 15,420 target.
Looking elsewhere, the Dow Jones Industrial Average continues to lag slightly behind.
Tactically, familiar support matches the May peak (35,091).
Tuesday’s close (35,100) registered nearby.
Delving deeper, the 50-day moving average, currently 35,022, is followed by the former range top (34,820).
Likely last-ditch support matches the August low (34,690). An eventual violation would mark a material “lower low” raising a question mark.
Meanwhile, the S&P 500 is digesting its latest break to record territory.
Tactically, the breakout point (4,480) marks the S&P’s first notable floor.
The bigger picture
As detailed above, the major U.S. benchmarks are off to a sluggish, but thus far largely uneventful, September start.
On a headline basis, the S&P 500 and Nasdaq Composite are digesting recent technical breakouts, while the Dow Jones Industrial Average continues to lag behind.
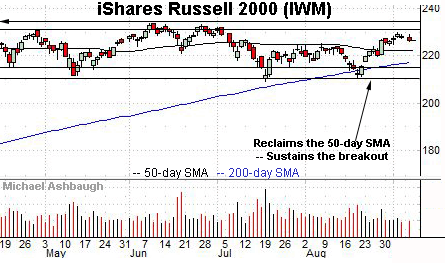
Moving to the small-caps, the iShares Russell 2000 ETF remains range-bound.
Within the range, the small-cap benchmark has sustained a recent break atop the 50-day moving average, currently 222.00.
Meanwhile, the SPDR S&P MidCap 400 ETF remains slightly stronger than the small-caps.
The MDY registered a nominal record close (506.04) last week, while still topping fractionally under its absolute record peak (507.63), established April 29.
More immediately, the relatively flattish pullback from resistance preserves a range-bound backdrop.
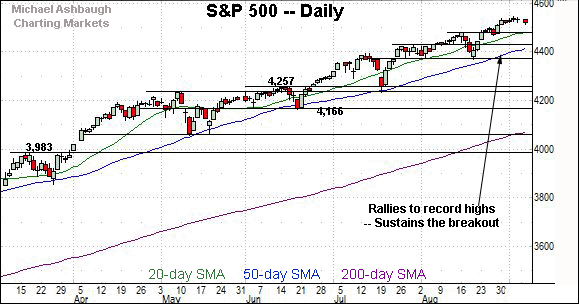
Placing a finer point on the S&P 500, the index is digesting its latest break to record territory.
To reiterate, Tuesday’s session low (4,513.00) precisely matched first support (4,513), detailed previously.
Delving deeper, the 4,500 mark is followed by the former breakout point (4,480).
More broadly, the S&P 500 has asserted a steady intermediate-term uptrend, tracking atop the 50-day moving average.
Tactically, the breakout point (4,480) is followed by the S&P’s former range top (4,430).
Delving deeper, the 50-day moving average, currently 4,417, is followed by major support (4,372) closely matching the August low.
As detailed previously, an eventual violation of this area would mark a material “lower low” — combined with a violation of the 50-day moving average — raising a technical question mark.
Looking elsewhere, the Nasdaq Composite has effectively reached its projected targets — the 15,370 and 15,420 areas, detailed previously. (See the hourly chart.)
A consolidation phase is due, and the pending selling pressure near current levels, or lack thereof, may add color.
Watch List
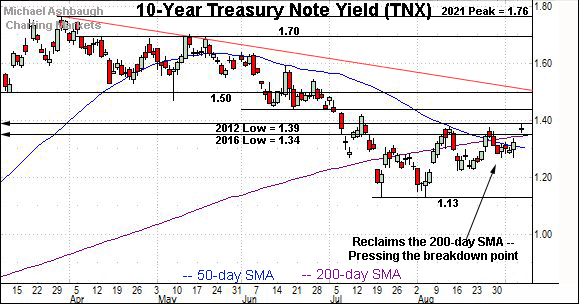
Drilling down further, the 10-year Treasury note yield has reached a potentially consequential technical test.
As detailed previously, the 2016 low (1.34) and 2012 low (1.39) define the 2020 breakdown point, the point from which the plunge to pandemic-zone territory originates. (See the Aug. 30 review.)
Against this backdrop, the August peak (1.38) and September peak (1.39) have effectively matched the breakdown point.
Broadly speaking, the prevailing backdrop supports a yield-bearish bias pending a sustained break atop the 1.39 area. The next several sessions may add color.
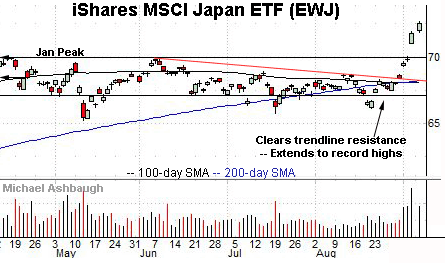
Looking elsewhere, the iShares MSCI Japan ETF — profiled last week — has taken flight.
Technically, the shares have extended a trendline breakout, knifing to all-time highs.
Though near-term overbought, and due to consolidate, the sustained strong-volume spike is longer-term bullish. Tactically, gap support (71.04) is followed by the breakout point (69.80).
Netflix, Inc. is a large-cap name taking flight.
As illustrated, the shares have staged a nearly straightline breakout, extending to record highs amid several new product introductions and an analyst upgrade. Recent follow-through punctuates a cup-and-handle defined by the May and August lows.
Tactically, the Jan. peak (593.30) is followed by the deeper breakout point (557.50). A sustained posture higher signals a bullish longer-term bias.
Facebook, Inc. is a well positioned large-cap name.
Late last month, the shares tagged record highs, clearing resistance matching the July peak. The subsequent bull flag is a continuation pattern, positioning the shares to extend the uptrend.
Tactically, the prevailing range bottom (373.10) is followed by the ascending 50-day moving average, currently 360.05, a level that has defined Facebook’s uptrend. The prevailing rally attempt is intact barring a violation.
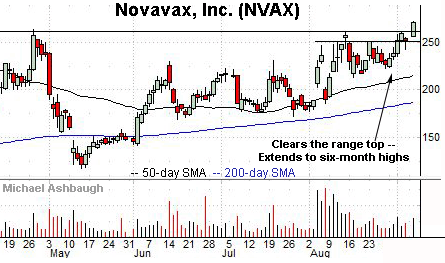
Novavax, Inc. is a large-cap biotech name coming to life.
As illustrated, the shares have tagged six-month highs, rising after Takeda Pharmaceutical Co. disclosed the Japanese government has agreed to buy 150 million COVID-19 vaccine doses that will be produced using Novavax’ formula.
The upturn opens the path to a less-charted patch, and potentially material follow-through. Tactically, the breakout point (260.00) is followed by the former range top (251.10).
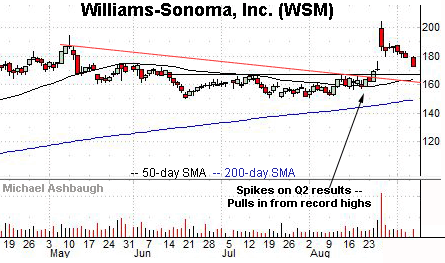
Finally, Williams-Sonoma, Inc. is a large-cap specialty retailer.
Late last month, the shares gapped to record highs, rising after the company’s strong second-quarter results.
The ensuing pullback has filled the gap, placing the shares 18.1% under the August peak. Delving deeper, the 50-day moving average is rising toward the breakout point (167.25). A sustained posture higher signals a bullish bias.


