Charting a bullish reversal: S&P 500, Nasdaq challenge record highs
Focus: Homebuilders maintain major support, Nvidia's earnings-fueled breakout attempt, XHB, NVDA, TEAM, SKIN, SONO
U.S. stocks are firmly higher early Monday, rising ahead of a widely-anticipated Federal Reserve meeting, and related policy signals, due out later this week.
Against this backdrop, the S&P 500 has knifed from its range bottom (4,372), rising to challenge all-time highs.
Editor’s Note: As always, updates can be directly accessed at chartingmarkets.substack.com.
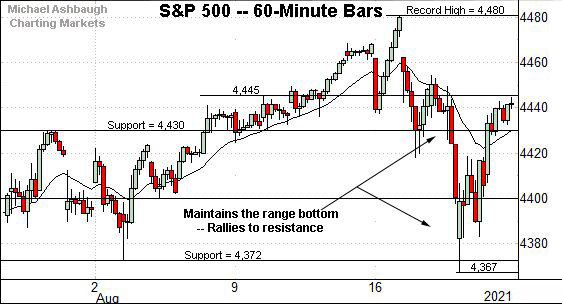
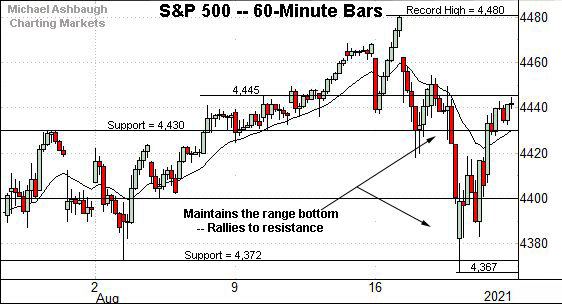
Before detailing the U.S. markets’ wider view, the S&P 500’s hourly chart highlights the past four weeks.
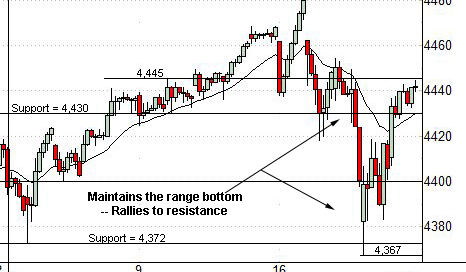
As illustrated, the S&P has reversed sharply from its range bottom (4,372), punctuating a second successful August retest.
Monday’s early follow-through places record highs within striking distance.
The S&P’s record close (4,479.71) and absolute record peak (4,480.26) closely match.
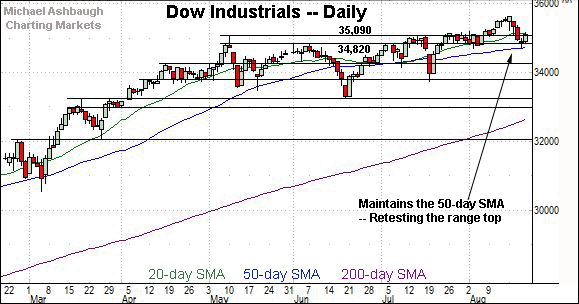
Similarly, the Dow Jones Industrial Average has maintained its one-month range bottom.
Its bullish reversal punctuates a successful test of the 50-day moving average, currently 34,744. (Also see the daily chart.)
Against this backdrop, the Nasdaq Composite has weathered a slightly more aggressive August downturn.
But here again, Monday’s strong start places record highs within view.
The Nasdaq’s record close (14,895.12) and absolute record peak (14,896.47) closely match, both established Aug. 5.
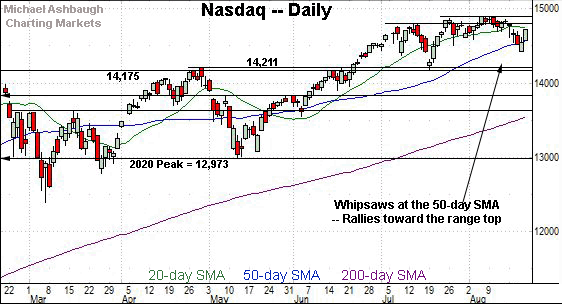
Widening the view to six months adds perspective.
On this wider view, the Nasdaq has reversed from one-month lows, punctuating a brief retest of the 50-day moving average.
The bullish reversal — and Monday’s strong start — place record highs firmly within view.
Tactically, a near-term target projects from the August range to the 15,370 area.
Separately, an intermediate-term target continues to project to the 15,420 area, detailed previously. (See for instance, the July 26 review.)
Looking elsewhere, the Dow Jones Industrial Average has maintained its 50-day moving average, currently 34,744.
Last week’s close (35,120) registered slightly above the range top (35,090) and the Dow has followed through firmly higher early Monday. Constructive price action.
Meanwhile, the S&P 500 has maintained a familiar floor matching its range bottom (4,372).
Last week’s low (4,367) — also the August low — registered nearby.
More immediately, the S&P has followed through higher, rising to challenge record territory early Monday.
The bigger picture
As detailed above, the major U.S. benchmarks continue to act reasonably well despite the recent volatility spike.
On a headline basis, each big three benchmark briefly tagged one-month lows last week, and has since reversed sharply, rising within striking distance of record territory.
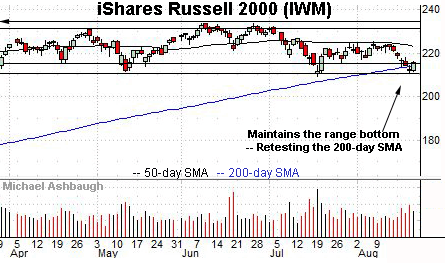
Moving to the small-caps, the iShares Russell 2000 ETF has maintained its range bottom — the 209.10-to-211.70 area — detailed previously.
A jagged test of the 200-day moving average, currently 214.35, remains underway.
The small-cap benchmark registered its first close under the 200-day moving average last week since September 2020.
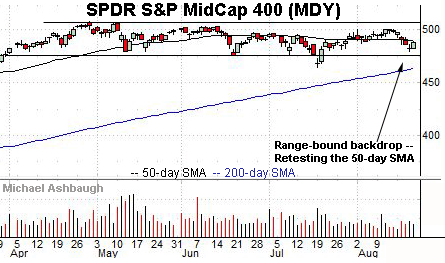
Meanwhile, the SPDR S&P MidCap 400 ETF remains comparably stronger than the small-caps.
Consider that its flatlining 50-day moving average, currently 489.55, roughly bisects the prevailing range.
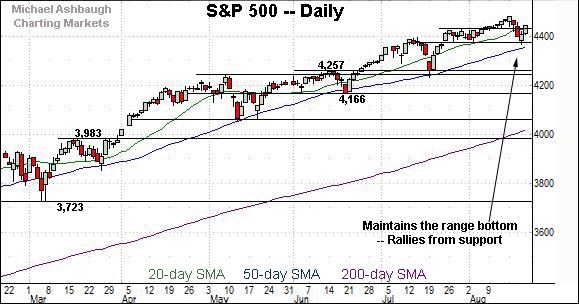
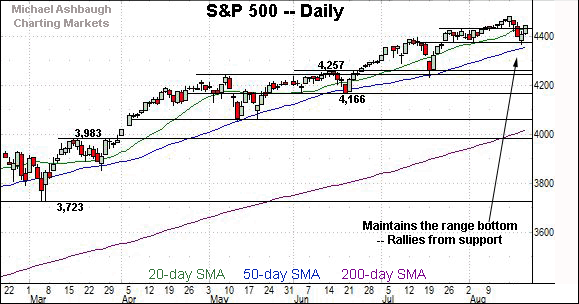
Placing a finer point on the S&P 500, the index has weathered a mid-August whipsaw.
The prevailing upturn originates from the range bottom (4,372), placing record highs within striking distance.
(On a granular note, Friday’s session high (4,444.3) closely matched near-term resistance (4,445).)
More broadly, the S&P 500’s bigger-picture backdrop remains relatively straightforward.
Tactically, the prevailing range bottom (4,372) is closely followed by the 50-day moving average, currently 4,357.
Last week’s low (4,367) registered in the vicinity of both levels.
As detailed previously, prior retests of the 50-day have marked intermediate-term lows, punctuated by a resumption of the uptrend.
Delving deeper, familiar last ditch-support matches the June breakout point (4,257) and the July closing low (4,258). The S&P 500’s intermediate-term bias remains bullish barring a violation of this area, though amid narrowing sector participation detailed last week.
Editor’s Note: The next review will be published Wednesday.
Watch List
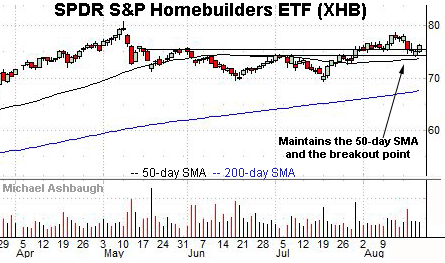
Drilling down further, the SPDR S&P Homebuilders ETF is acting relatively well technically.
Late last month, the group tagged three-month highs, punctuating a double bottom defined by the June and July lows.
The ensuing pullback has been flattish, and underpinned by the breakout point.
Delving slightly deeper, the 50-day moving average, currently 73.75, has marked a bull-bear inflection point. The group’s intermediate-term bias remains bullish barring a violation.
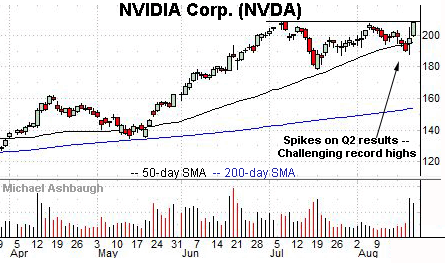
Nvidia Corp. is a well positioned large-cap semiconductor name.
Late last week, the shares knifed to the range top, rising after the company’s strong second-quarter results.
The strong-volume spike places Nvidia’s record high (208.75) under siege.
Last week’s high (208.65) registered just 10 cents lower, and the shares have ventured atop resistance early Monday. A near-term target projects to the 225 area on follow-through.
Initially profiled June 21, Atlassian Corp. has returned 29.5% and remains well positioned.
Late last month, the shares knifed to record territory, gapping higher after the company’s fourth-quarter results.
The subsequent flag-like pattern — (the tight August range) — has formed amid decreased volume, positioning the shares to build on the initial spike. Last week’s record close opens the path to a near-term target in the 357 area.
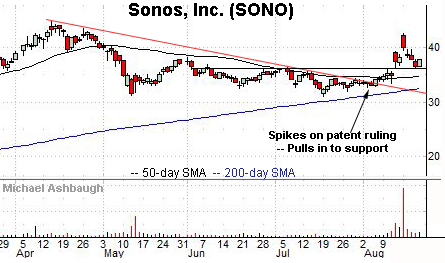
Sonos, Inc. is a mid-cap producer of wireless speakers, home-theater systems and related accessories.
Technically, the shares have recently knifed to three-month highs, rising after a favorable patent ruling, indicating Alphabet-owned Google infringed on a Sonos patent.
The subsequent pullback places the shares near the breakout point and 12.6% under the August peak.
Tactically, a sustained posture atop gap support (36.13) signals a bullish bias.
Last week’s low (36.16) closely matched gap support.
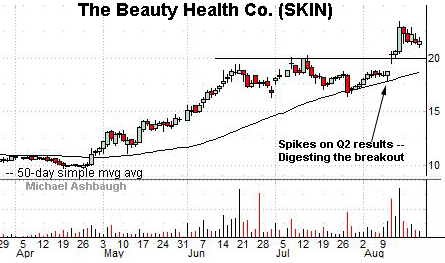
Public since November 2020, Beauty Health Co. is a mid-cap producer of skin-care products.
Earlier this month, the shares knifed to record highs, rising after the company’s strong quarterly results.
The subsequent pullback has been comparably flat, placing the shares 8.5% under the August peak.
Tactically, the post-breakout low, circa 21.00, is followed by the breakout point (19.90). A sustained posture higher signals a bullish bias.
Editor’s Note: The next review will be published Wednesday.

