Bull trend persists: S&P 500 extends break to uncharted territory
Focus: 10-year yield capped by key level amid death cross, TNX, MCHP, ON, NTAP, OKTA, BBY
U.S. stocks are higher early Monday, rising as unseasonally bullish August price action persists.
Against this backdrop, the S&P 500 and Nasdaq Composite have extended late-month breakouts, placing distance atop round-number milestones — S&P 4,500 and Nasdaq 15,000.
Editor’s Note: As always, updates can be directly accessed at chartingmarkets.substack.com.
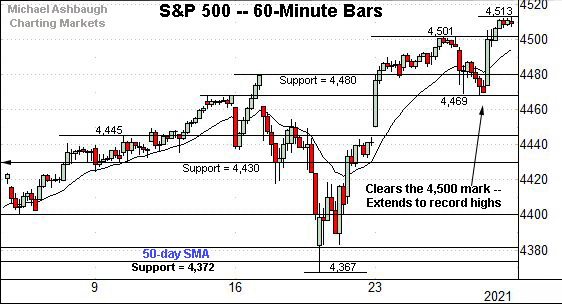
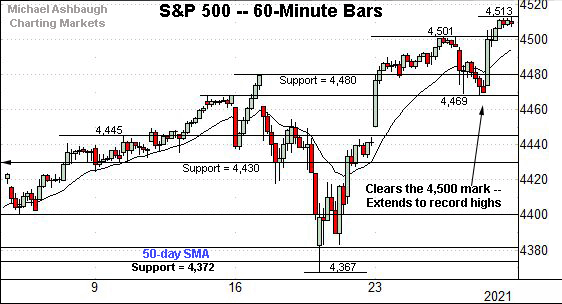
Before detailing the U.S. markets’ wider view, the S&P 500’s hourly chart highlights the past four weeks.
As illustrated, the S&P has extended its break to record territory.
Tactically, the 4,500 area is followed by the former breakout point (4,480).
More broadly, the prevailing upturn originates from the one-month range bottom (4,372).
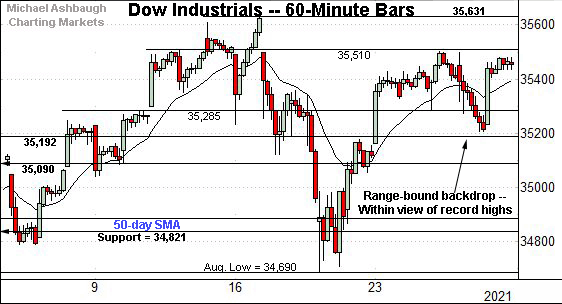
Meanwhile, the Dow Jones Industrial Average has not reached record territory.
The index remains capped by near-term resistance (35,510), detailed repeatedly.
Monday’s early session high (35,510) has precisely matched resistance.
More broadly, the prevailing upturn punctuates a successful test of the 50-day moving average, an area also detailed on the daily chart.
True to recent form, the Nasdaq Composite remains the strongest major benchmark, extending a decisive break to record territory.
Tactically, the former range top (15,059) is followed by the post-breakout low (14,939) and the firmer breakout point (14,896).
Here again, the Nasdaq’s prevailing upturn originates from recent one-month lows.
Widening the view to six months adds perspective.
On this wider view, the Nasdaq has extended its rally atop the 15,000 mark. The prevailing upturn punctuates a jagged test of the 50-day moving average.
On further strength, a near-term target projects from the August range to the 15,370 area.
Separately, a slightly more distant intermediate-term target projects to the 15,420 area, detailed repeatedly.
Looking elsewhere, the Dow Jones Industrial Average has not yet reached record territory.
Nonetheless, the index has sustained a bullish reversal above its range top (35,090).
Recall the prevailing upturn punctuates a successful test of the 50-day moving average. Constructive price action.
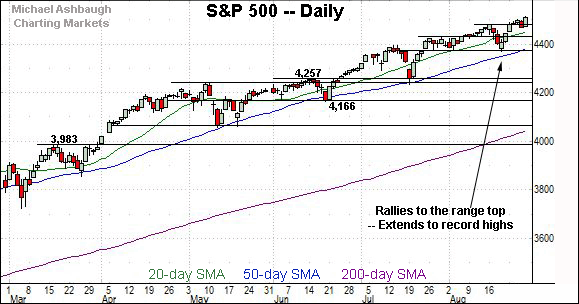
Meanwhile, the S&P 500 has extended a slight break atop the 4,500 mark.
The prevailing upturn punctuates a successful test of the range bottom (4,372), an area detailed repeatedly.
The bigger picture
As detailed above, the major U.S. benchmarks seem poised to conclude August on a bullish note.
On a headline basis, the S&P 500 and Nasdaq Composite have extended late-month breaks to record territory, placing distance atop round-number milestones — S&P 4,500 and Nasdaq 15,000.
Meanwhile, the Dow Jones Industrial Average remains capped by its record high as market rotation persists.
Moving to the small-caps, the iShares Russell 2000 ETF is showing signs of a pulse.
As illustrated, the benchmark has reclaimed its 50-day moving average, currently 222.37, rising amid increased volume.
Last week marked the small-cap benchmark’s best weekly performance since March.
Meanwhile, the SPDR S&P MidCap 400 ETF is challenging records highs.
In fact, last week’s close (504.96) marked a record close, though by a narrow 15 cent margin.
The MDY’s absolute record peak (507.63), established April 29, remains just overhead.
The prevailing upturn punctuates a prolonged range — and has been fueled by increased volume — laying the groundwork for potentially material upside follow-through.
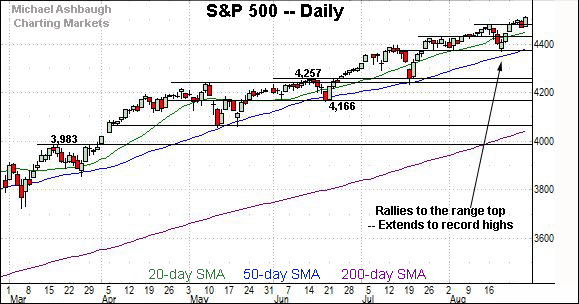
Placing a finer point on the S&P 500, the index has extended its late-August break to record territory.
Tactically, the 4,500 area is followed by the former breakout point (4,480).
More broadly, the S&P 500 has staged a bull-flag breakout of sorts.
The slight rally atop the 4,500 mark punctuates last week’s relatively tight range, fueled by dovish-leaning Federal Reserve policy remarks.
Tactically, the 50-day moving average, currently 4,385, is followed by major support (4,372), the area from which the prevailing upturn originates. A sustained posture higher signals a bullish intermediate-term bias.
Conversely, the S&P has already reached its initial target (4,510), detailed previously. Last week’s close (4,509.4) registered nearby.
More distant upside targets continue to project to the 4,553 and 4,590 areas.
Watch List
Drilling down further, the 10-year Treasury note yield has reached a notable technical test.
Namely, the yield is retesting its 50-day moving average (1.32) and 200-day moving average (1.33) in the wake of last week’s dovish-leaning Federal Reserve policy language.
As detailed previously, the 50-day moving average has marked a useful intermediate-term trending indicator going back as far as 2019.
Against this backdrop, the yield signaled a death cross — or bearish 50-day/200-day moving average — to conclude last week.
Separately — but notably — the 2016 low (1.34) and 2012 low (1.39) define the 2020 breakdown point, the point from which the plunge to pandemic-zone territory originates. The August peak (1.38) has effectively matched the breakdown point amid a failed retest from underneath.
Tactically, the prevailing backdrop supports a yield-bearish bias pending a sustained break atop the August peak (1.38).
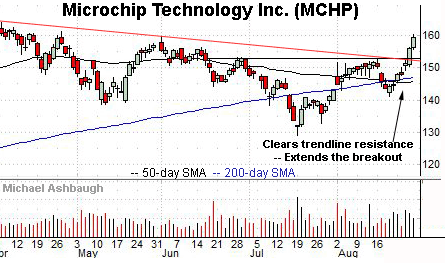
Microchip Technology, Inc. is a large-cap semiconductor name coming to life.
Technically, the shares have staged a trendline breakout, rising after the company announced a 2-for-1 stock split, effective Oct. 4.
Though near-term extended, and due to consolidate, the straightline spike is longer-term bullish. Tactically, trendline support closely matches the breakout point (152.55).
ON Semiconductor Corp. is a well positioned large-cap semiconductor name.
The shares initially spiked four weeks ago, gapping higher after the company’s strong quarterly results.
The subsequent pullback has been underpinned by the breakout point, and punctuated by a late-August rally to challenge record highs.
Tactically, last week’s close (45.50) missed a record close by just 17 cents. An intermediate-term target projects to the 50.50 area on follow-through.
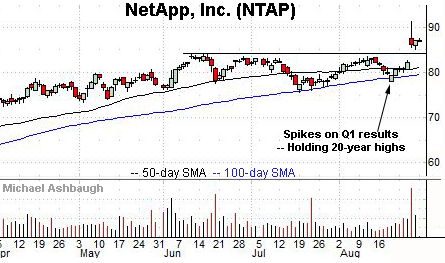
NetApp, Inc. is a well positioned large-cap data-storage name. (Yield = 2.3%.)
As illustrated, the shares have recently knifed to 20-year highs, rising after the company’s strong first-quarter results.
By comparison, the subsequent pullback has been flat, positioning the shares to build on the initial spike. Tactically, the post-breakout low (85.20) is closely followed by the breakout point (84.20).
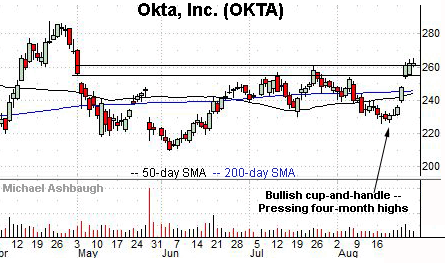
Okta, Inc. is a large-cap name coming to life.
Technically, the shares have knifed to the range top, rising amid increased volume after an analyst upgrade. The upturn punctuates a bullish cup-and-handle defined by the June and August lows.
Tactically, the July peak (261.00) is followed by gap support (255.50). A breakout attempt is in play barring a violation.
Note the company’s quarterly results are due out Wednesday, Sept. 1.
Finally, Best Buy Co., Inc. is a well positioned large-cap name. (Yield = 2.4%.)
As illustrated, the shares have recently knifed to three-month highs, rising after the company’s second-quarter results.
The subsequent pullback places the shares at an attractive entry 6.3% under the August peak.
Tactically, trendline support roughly matches the top of the gap (116.35). The prevailing rally attempt is intact barring a violation.


