Charting the latest round-number milestones: S&P 4,700 and Nasdaq 16,000
Focus: Industrial Sector ETF challenges record highs, Alphabet tags the $2 trillion mark (and the 3,000 mark), XLI, GOOGL, TER, ETSY, JBLU
U.S. stocks are higher midday Monday, though well off the session’s best levels, rising as bullish November momentum persists.
Against this backdrop, the S&P 500 and Nasdaq Composite seem to be consolidating rallies to their latest round-number milestones — S&P 4,700 and Nasdaq 16,000.
Editor’s Note: As always, updates can be directly accessed at chartingmarkets.substack.com.
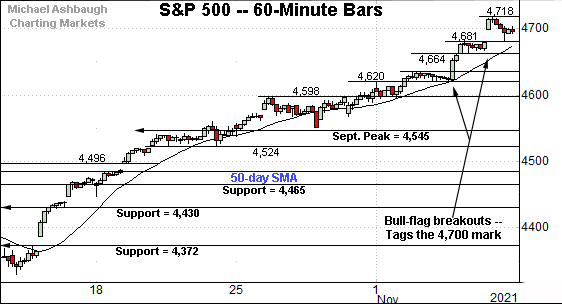
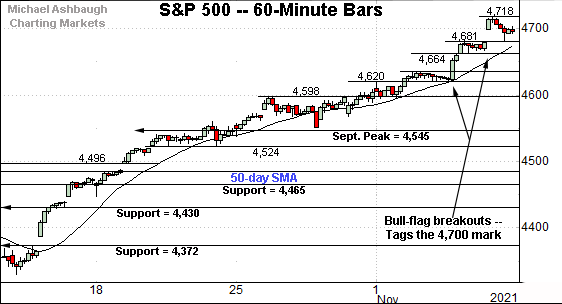
Before detailing the U.S. markets’ wider view, the S&P 500’s hourly chart highlights the past four weeks.
As illustrated, the S&P has tagged the 4,700 mark for the first time on record.
The round-number milestone has registered exactly one week after the index first reached the 4,600 mark.
Technically, the prevailing follow-through punctuates consecutive flag patterns amid still muted selling pressure.
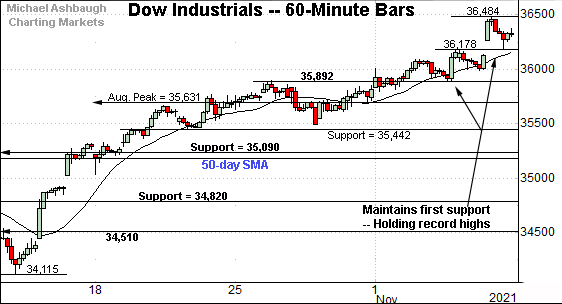
Similarly, the Dow Jones Industrial Average has extended its breakout.
From current levels, initial support (36,178) is followed by the firmer breakout point (35,892).
The post-breakout low (35,891) effectively matched the breakout point (35,892) as detailed previously. Bullish price action.
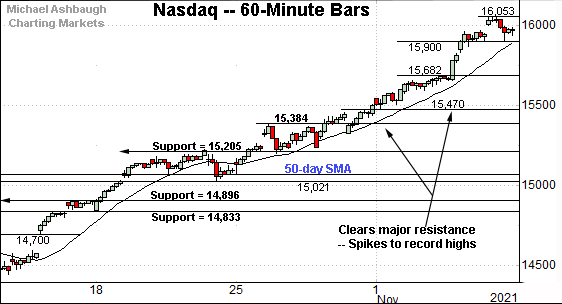
Against this backdrop, the Nasdaq Composite has also taken flight, tagging the 16,000 mark for the first time on record.
Tactically, near-term support (15,900) is followed by the early-November breakout point (15,682).
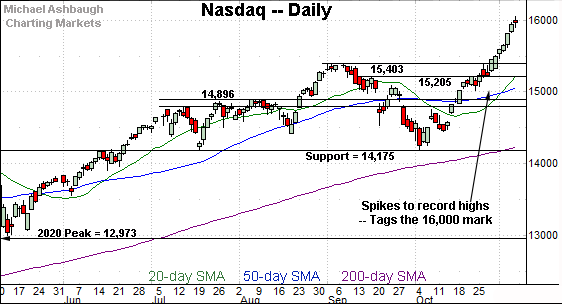
Widening the view to six months adds perspective.
On this wider view, the Nasdaq has started November with a massive 3.7% technical breakout.
The nearly straightline spike confirms the primary uptrend.
Tactically, near-term support is not well-defined. The Nasdaq’s breakout point — the 15,384-to-15,403 area — marks the first notable floor.
Conversely, an intermediate-term target continues to project to the 16,550 area. (See the Oct. 27 review.)
Looking elsewhere, the Dow Jones Industrial Average has thus far staged a strong 1.9% breakout.
Technically, the strong November start marks the “expected” follow-through on the Dow’s steep mid-October spike. (Recall three of four mid-October closes registered atop the 20-day volatility bands amid a powerful two standard deviation breakout.)
Though near-term extended, and due to consolidate at some point, the persistent rally from the October low is longer-term bullish.
Tactically, an intermediate-term target projects from the former range to the 37,420 area.
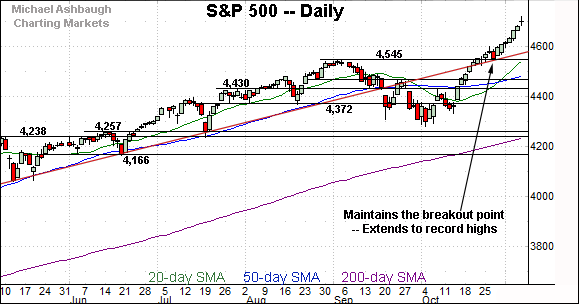
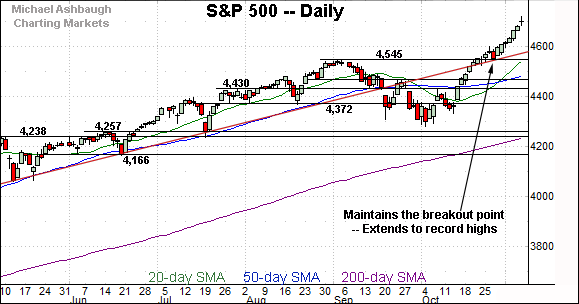
Meanwhile, the S&P 500 has staged an aggressive 3.3% technical breakout.
Tactically, recall the post-breakout low (4,551) roughly matched trendline support and breakout point (4,545). Bullish price action.
The bigger picture
As detailed above, the major U.S. benchmarks are acting well technically.
On a headline basis, each big three benchmark has extended its break to record territory, rising as market participation continues to broaden.
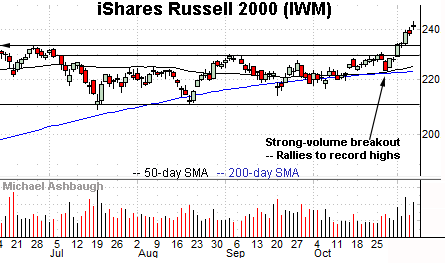
Moving to the small-caps, the iShares Russell 2000 ETF’s backdrop exemplifies broadening participation.
The formerly lagging small-cap benchmark has knifed to record territory, rising amid a strong two standard deviation breakout, encompassing four straight closes atop the 20-day Bollinger bands. (See this link for chart.)
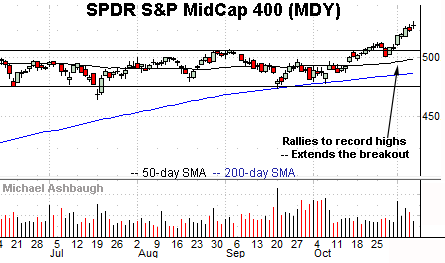
Similarly, the SPDR S&P MidCap 400 ETF has reached previously uncharted territory.
Recall the strong November start punctuates a prolonged range — a coiled spring — opening the path to potentially material longer-term follow-through.
Placing a finer point on the S&P 500, the index continues to take flight.
Bullish momentum is intact, for now, as the S&P trends firmly atop its 20-hour moving average.
More broadly, the S&P 500 is increasingly extended — and up on a stilt — amid a strong November start.
Against this backdrop, the index concluded last week with a doji — (a session punctuated by an open and close that closely match) — signaling hesitation, or indecision, as to the very near-term direction.
Against this backdrop, a sideways cooling-off period near current levels would not be unexpected.
But more importantly, the aggressive November breakout is longer-term bullish.
On further strength, an intermediate-term target projects to the 4,775-to-4,790 area, as detailed repeatedly.
Watch List
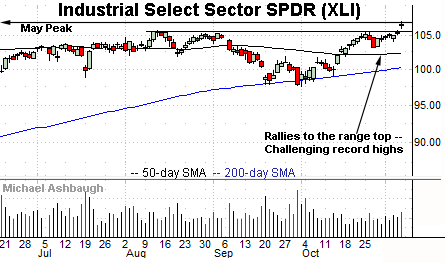
Drilling down further, the Industrial Select Sector SPDR has reached a key technical test.
Specifically, the group is challenging record highs, territory matching the May peak (106.81).
Last week’s high (107.05) marked a fractional record peak, though the breakout attempt technically remains underway.
Tactically, an intermediate-term target projects to the 113 area on follow-through.
(More broadly, notice the successful test of the 200-day moving average at the October low.)
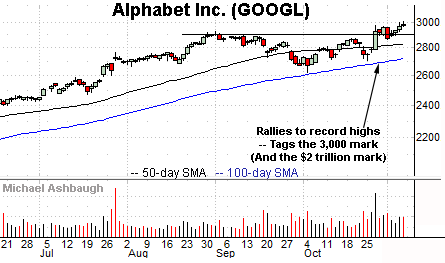
Moving to specific names, Alphabet, Inc. has reached a headline-grabbing milestone.
Specifically, the shares have tagged the $2 trillion mark — (defined by a market capitalization, or market value, of $2 trillion) — joining Apple and Microsoft as just the third company to attain this value.
The prevailing upturn punctuates a flag pattern, hinged to the late-October earnings-fueled rally.
Tactically, the breakout point, circa 2,900, is followed by the post-breakout low (2,864.50). A sustained posture higher signals a bullish bias.
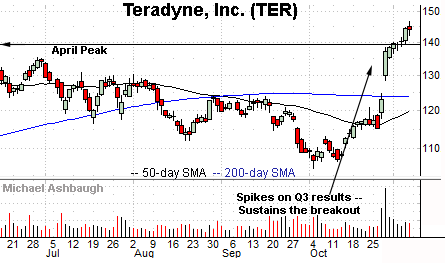
Teradyne, Inc. is a well positioned large-cap semiconductor name.
Late last month, the shares knifed to eight-month highs, gapping atop the 200-day moving average after the company’s quarterly results.
More broadly, the shares are well positioned on the five-year chart, challenging record highs from a continuation pattern hinged to the massive 2020 rally.
Tactically, a sustained posture atop the April peak (139.30) signals a firmly-bullish bias.
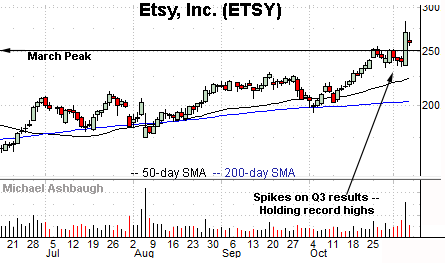
Etsy, Inc. is a well positioned large-cap name.
Late last week, the shares knifed to all-time highs, rising after the company’s third-quarter results. The strong-volume spike punctuates a late-October flag pattern.
Tactically, the breakout point (252.50) pivots to well-defined support. A sustained posture higher signals a bullish bias.
Finally, JetBlue Airways Corp. is a large-cap carrier coming to life.
Technically, the shares have gapped atop trendline resistance, rising amid optimism over positive trial data for Pfizer’s developmental COVID-19 treatment.
The strong-volume spike signals a trend shift.
Tactically, gap support (15.70) is followed by the trendline, a level tracking the 100-day moving average, currently 15.48. The recovery attempt is intact barring a violation.


