Bull trend accelerates: S&P 500, Nasdaq take flight to uncharted territory
Focus: Dow industrials nail the breakout point, Russell 2000 stages statistically aggressive break to record highs
Technically speaking, the major U.S. benchmarks have taken flight, knifing to record territory amid an unusually strong November start.
Perhaps as notably, the small- and mid-cap benchmarks have concurrently staged consequential breakouts — breaks from prolonged six-month ranges — as the prevailing bull trend continues to broaden.
Editor’s Note: As always, updates can be directly accessed at chartingmarkets.substack.com.
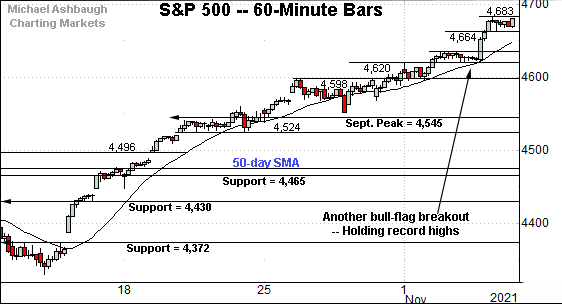
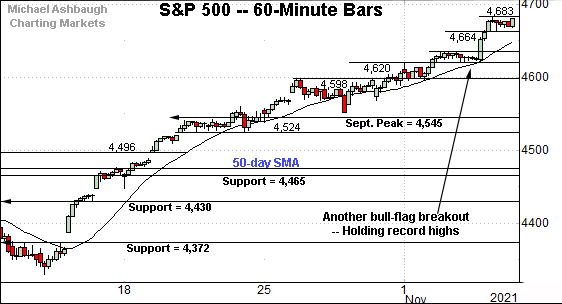
Before detailing the U.S. markets’ wider view, the S&P 500’s hourly chart highlights the past four weeks.
As illustrated, the S&P continues to trend firmly higher.
Recent follow-through punctuates another bull flag — the tight two-session range — underpinned by the 20-hour moving average.
Tactically, near-term support (4,664) is followed by the early-week range top (4,635).
Meanwhile, the Dow Jones Industrial Average has sustained a break to record territory.
In the process, the index has closely observed its breakout point (35,892), an area detailed previously.
The mid-week low (35,891) registered nearby amid bullish price action.
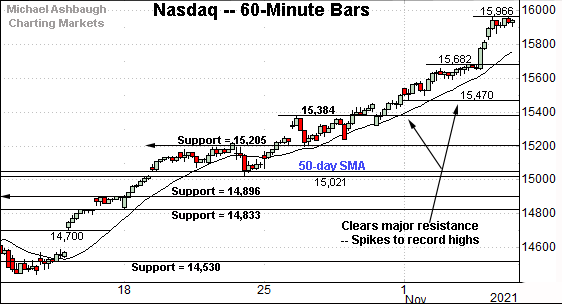
Against this backdrop, the Nasdaq Composite has truly taken flight.
The strong November start punctuates a rally atop major resistance — the 15,384-to-15,403 area — also illustrated below.
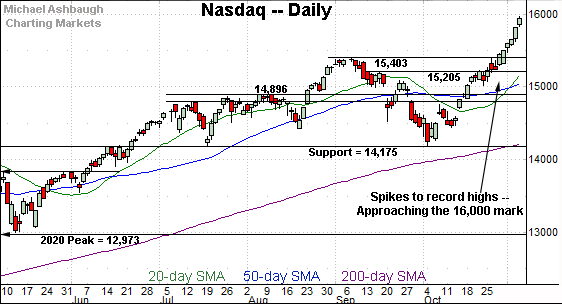
Widening the view to six months adds perspective.
On this wider view, the “potentially consequential upside follow-through” — detailed previously — has indeed surfaced amid a strong November start. (See the Oct. 27 review.)
Though near-term extended, and likely due a sideways chopping around phase, the Nasdaq’s nearly straightline spike is longer-term bullish.
On further strength, an intermediate-term target continues to project to the 16,550 area.
More broadly, the prevailing leg higher originates from major support (14,175). Recall the October low (14,181) registered nearby.
(On a granular note, the Nasdaq’s November rally has not marked a two standard deviation breakout, a function of its steep slope, and virtually nonexistent pullbacks.)
Looking elsewhere, the Dow Jones Industrial Average has sustained a break atop the 36,000 mark.
Recall recent follow-through builds on the Dow’s aggressive mid-October rally.
Tactically, an intermediate-term target projects from the former range — roughly underpinned by the September and October lows — to the 37,420 area.
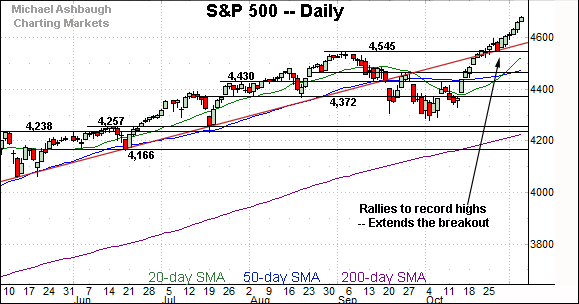
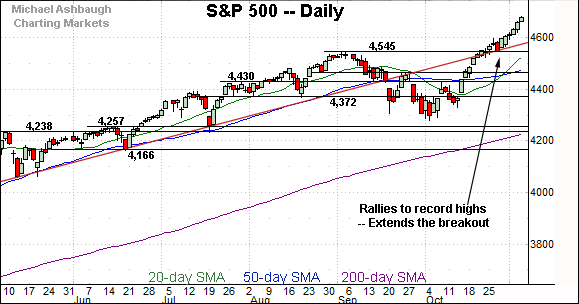
Meanwhile, the S&P 500’s November breakout has accelerated.
The steep follow-through punctuates a successful test of trendline support roughly matching the breakout point (4,545).
The post-breakout low (4,551) registered slightly above major support. (Also see the hourly chart.)
The bigger picture
As detailed above, the major U.S. benchmarks have started November — and the best six months seasonally — on a firmly bullish note.
Each big three benchmark has extended its break to previously uncharted territory, rising amid still conspicuously muted selling pressure.
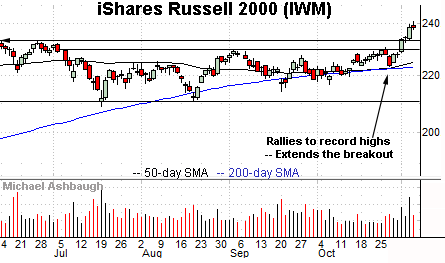
Moving to the small-caps, the iShares Russell 2000 ETF has extended its break to record highs.
Recall the initial breakout marked an unusually strong two standard deviation spike, encompassing consecutive closes atop the 20-day Bollinger bands. (See this link for chart.)
As detailed repeatedly, the prevailing upturn punctuates a prolonged range, laying the groundwork for potentially material longer-term follow-through.
Similarly, the SPDR S&P MidCap 400 ETF has reached previously uncharted territory.
Here again, the strong November start punctuates a prolonged range — a coiled spring, of sorts — opening the path to potentially aggressive follow-through.
Placing a finer point on the S&P 500, the index has taken flight.
Tactically, recall the S&P has effectively trended atop its 20-hour moving average across nearly one month.
The prevailing bull-flag breakout punctuates a successful test of near-term support (4,620) closely matching the 20-hour moving average.
More broadly, the S&P 500’s six-month view remains relatively straightforward.
To start, the index has reached uncharted territory — capped by no true resistance — and it’s acting like it.
Put differently, virtually every individual invested in the S&P 500 Index is sitting on a gain, reducing the collective incentive to sell. (In concept, few investors are waiting to reach a break-even point, and liquidate the position.)
When sellers are absent, prices rise to attract new sellers, a process that remains underway.
As it applies to technical levels, trendline support is closely followed by the breakout point (4,545).
Delving deeper, more important support matches the 50-day moving average, currently 4,477, the late-September peak (4,465) and the 4,430 mark.
As detailed repeatedly, the S&P 500’s intermediate-term bias remains bullish barring a violation of the 4,430 area.
Conversely, an intermediate-term target projects to the 4,775-to-4,790 area — detailed previously — levels that are increasingly within striking distance.
No new setups today. Back in action Monday.


