


Charting market cross currents, S&P 500 violates 50-day average
Focus: 10-year Treasury yield challenges 15-year highs, Financials retest 200-day average, Health care sector sustains summer breakout

Technically speaking, the major U.S. benchmarks have asserted an August downtrend, pressured as the 10-year Treasury note yield challenges 15-year highs.
Amid the cross currents, the S&P 500 and Nasdaq Composite have violated their respective 50-day moving averages even as the Dow Jones Industrial Average remains comparably resilient. The prevailing backdrop is not one-size-fits-all.
Editor’s Note: As always, updates can be directly accessed at https://chartingmarkets.substack.com.
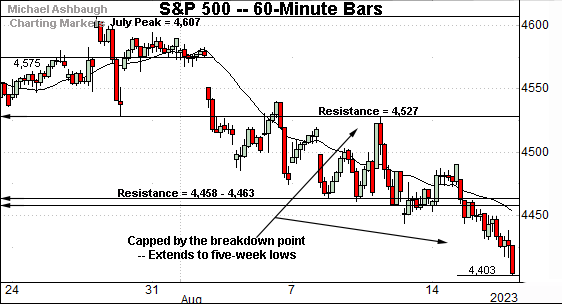
Before detailing the U.S. markets’ wider view, the S&P 500’s hourly chart highlights the past four weeks.
As illustrated, the S&P 500 has staged an August downturn.
The prevailing pullback has encompassed a failed test of the breakdown point (4,527) — detailed previously — and downside follow-through to five-week lows. Bearish near-term price action.
(On a granular note, the breakdown point (4,527) effectively matches the S&P’s former upside target (4,530). See the July 13 review at the S&P 500’s weekly chart.)
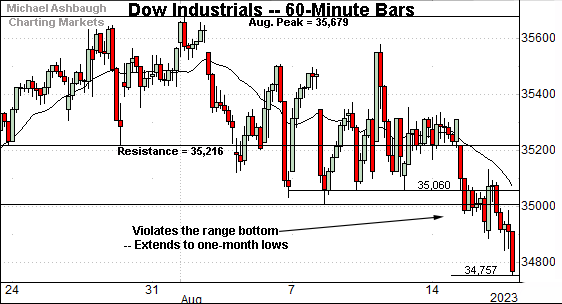
Meanwhile, the Dow Jones Industrial Average has more recently turned lower.
Tactically, the breakdown point (35,060) is followed by familiar overhead in the 35,220 area. (Also see the daily chart.)
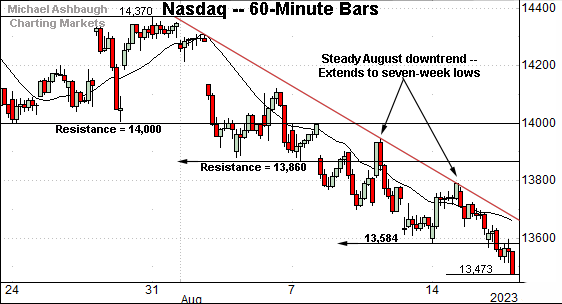
Against this backdrop, the Nasdaq Composite remains the weakest benchmark on this near-term view.
As illustrated, the index has asserted a steady August downtrend punctuated by lackluster mid-month rally attempts. The prevailing pullback places the Nasdaq at seven-week lows.
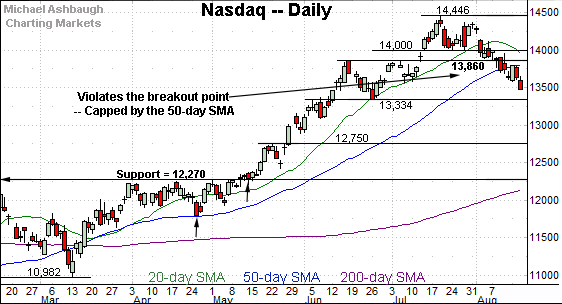
Widening the view to six months adds perspective.
On this wider view, the Nasdaq’s August downturn has inflicted at least modest technical damage.
Specifically, the index has violated its breakout point (13,860) as well as the 50-day moving average, currently 13,800.
Moreover, the recent rally attempt has been capped by the 50-day moving average. As always, the 50-day is a widely-tracked intermediate-term trending indicator. The August downturn marks the Nasdaq’s first price action under the 50-day since March.
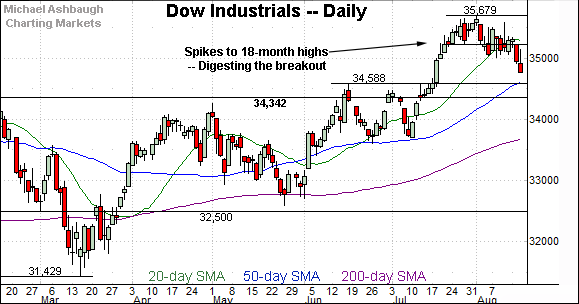
Looking elsewhere, the Dow Jones Industrial Average has strengthened versus the other benchmarks amid rotational price action. Large-cap technology weakness has contributed to the Dow industrials’ relative strength.
Still, the prevailing downturn places notable support within view. Tactically, the 50-day moving average, currently 34,618, is closely followed by the breakout point (34,588).
Tactically, a violation of this area would raise a caution flag. Recall the 50-day moving average underpinned the June and July lows.
(On a granular note, Tuesday’s session high (35,219, long red bar) matched a familiar inflection point (35,216) detailed previously. This area remains in play technically.)

Meanwhile, the S&P 500 has pulled in more aggressively than the Dow industrials.
In the process, the index has violated its breakout point — the 4,460 area — as well as the 50-day moving average, currently 4,451. The pending retest of this area from underneath will likely add color.
The bigger picture
As detailed above, the major U.S. benchmarks have diverged modestly amid a persistent August downturn. Each index is doing slightly different things.
On a headline basis, the S&P 500 and Nasdaq Composite have violated their 50-day moving average, areas roughly matching notable support. This marks the first material violations of support since May.
Meanwhile, the Dow Jones Industrial Average remains comparably resilient, thus far sustaining its aggressive July breakout.
Combined, the prevailing backdrop is not one-size-fits-all as the benchmarks navigate an unfavorable seasonal period through September and October. (The best six-month seasonal phase spans November through April.)
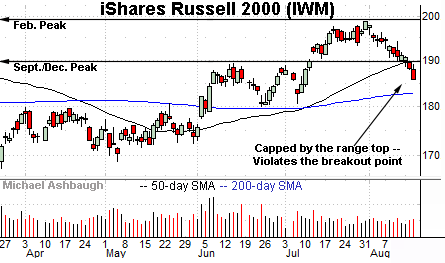
Moving to the small-caps, the iShares Russell 2000 ETF (IWM) has balked at its range top, a level matching the February peak (199.26).
The prevailing downturn places it back under the breakdown point (189.25), a level closely matching the 50-day moving average. The pending retest of this area, from underneath, should be a useful bull-bear gauge.
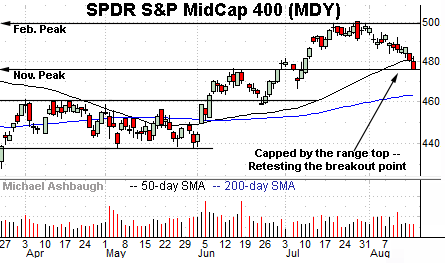
Meanwhile, the SPDR S&P MidCap 400 ETF (MDY) remains slightly stronger.
Still, an extended test of the breakout point — the 475 area — remains underway. Here again, the prevailing downturn originates from the range top, an area matching the February peak.
Combined, the small- and mid-caps have registered August downturns in tandem with the major U.S. benchmarks.
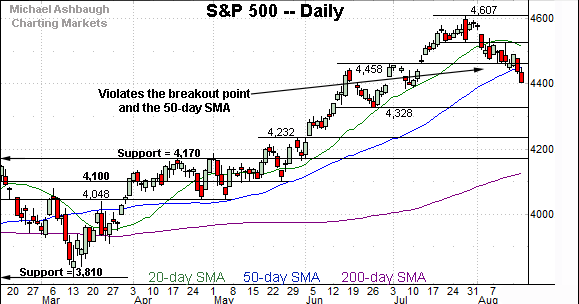
Returning to the S&P 500, an overdue consolidation phase remains underway. Recall the index had registered an eight-week 10.5% rally to the July peak.
But amid the recent downturn, the S&P has violated its breakout point (4,458) as well as the nearby 50-day moving average, currently 4,451. This marks its first violation of material support since May.
So tactically, the 4,460 area — detailed previously — marks an intermediate-term bull-bear fulcrum. The relatively aggressive violation of this area — on the first approach — signals a bearish intermediate-term bias.
On further weakness, the S&P 4,385 area marks the next notable floor, detailed in the July 13 review. (Separately, the 50% retracement of the summer rally rests at 4,389. Add the June low and July peak: 4,171 + 4,607 = 8,778. Then, divide the result by two: 8,778 / 2 = 4,389.)
Delving deeper, the late-June low (4,328) marks an inflection point. An eventual violation of this area would mark a material “lower low” raising the flag to potential bigger-picture questions.
As always, it’s not just what the markets do, it’s how they do it. But broadly speaking, the S&P 500 has signaled a bearish intermediate-term bias within the context of a still comfortably bullish bigger-picture backdrop.
The response to deeper support points — around 4,385 and 4,330 — may add color.
Also see Aug. 2: Charting a bull-bear battle, S&P 500 digests summer breakout.
Watch List
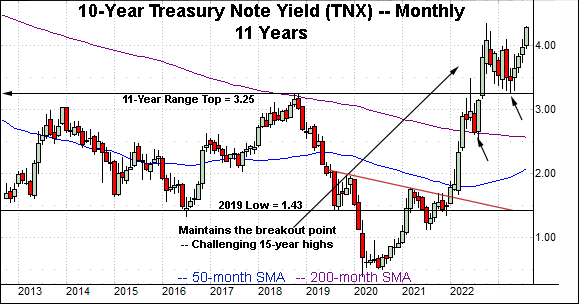
Drilling down further, the 10-year Treasury note yield (TNX) has taken flight, rising to challenge 15-year highs amid worries that inflation may be stickier than expected.
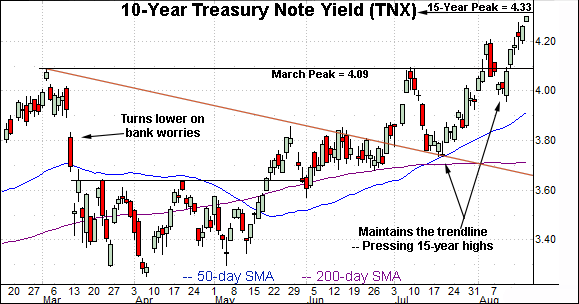
Tactically, the 2022 peak (4.33) is firmly within view, the yield’s highest level since November 2007. The pending retest of this area marks a “watch out.” An eventual break higher opens the path to much less-charted territory, and potententially sharp upside follow-through.
More broadly, the prevailing upturn originates from trendline support closely matching the 50-day moving average at the July low. The relatively steep lift from this area — straight to a key level — lays the groundwork for potential upside follow-through.
Also notice on the monthly chart, the yield’s massive 2022 spike and successful test of the breakout point (3.25). The 2023 low (3.25) has precisely matched the breakout point, a level defined by the 2018 peak (3.25). (This area has been detailed previously. See the April 5 review.)
From current levels, the former range top (4.09) marks a bull-bear fulcrum.
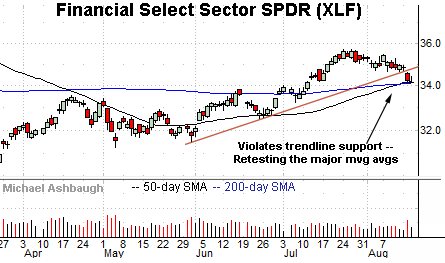
Moving to U.S. sectors, the Finacial Select Sector SPDR (XLF) has reached a headline technical test.
Specifically, the group is pressing its 200-day moving average, currently 34.10, a level closely matching the 50-day moving average.
This area is closely followed by the group’s breakout point (33.90). An eventual violation would raise a caution flag.
Amid the downturn, the group has violated trendline support on increased volume. Broadly speaking, the group’s response to the 33.90-to-34.10 area is worth tracking.
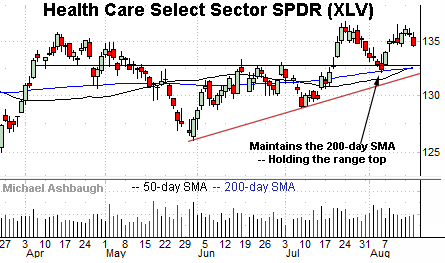
Finally, the Health Care Select Sector SPDR (XLV) is acting relatively well technically.
As illustrated, the group has sustained a recent break to eight-month highs.
Tactically, trendline support is rising toward the breakout point (132.70) a level closely matching the 50- and 200-day moving averages. A sustained posture atop this area signals a bullish bigger-picture bias.