Charting another summer breakout, S&P 500 approaches next target (4,545)
Focus: Nasdaq presses 14,000 mark, Small- and mid-caps signal broadening market strength
Technically speaking, the U.S. benchmarks’ bigger-picture backdrop remains comfortably bullish.
On a headline basis, the S&P 500 and Nasdaq Composite have extended summer breakouts, rising to tag 52-week highs.
Meanwhile, the Dow Jones Industrial Average has nailed its range top, rising amid a backdrop that continues to set up well for longer-term uspide.
Editor’s Note: As always, updates can be directly accessed at https://chartingmarkets.substack.com.
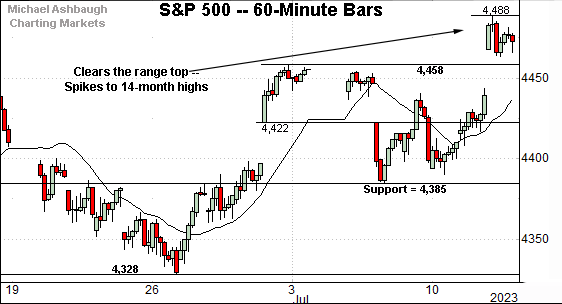
Before detailing the U.S. markets’ wider view, the S&P 500’s hourly chart highlights the past four weeks.
As illustrated, the S&P 500 has broken out, rising after the June consumer inflation report (CPI) registered a 3.0% annual rate, the lowest reading since March 2021.
Tactically, the 4,458-to-4,463 area pivots to support, levels matching the breakout point and gap support.
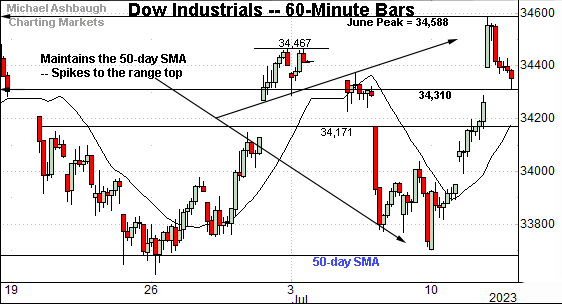
Meanwhile, the Dow Jones Industrial Average has not yet broken out.
Instead, the blue-chip benchmark has tagged its range top, a level matching the June peak (34,588).
The week-to-date peak (34,586) has registered within two points. (Also see the daily chart.)
Slightly more broadly, the prevailing upturn originates from the 50-day moving average, an area that has underpinned the one-month range.
(On a granular note, consider that Wednesday’s session low (34,308) closely matched familiar support (34,310) detailed previously.)
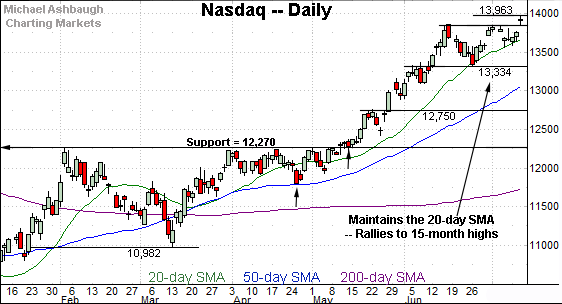
Against this backdrop, the Nasdaq Composite has tagged 15-month highs.
Tactically, the breakout point (13,844) effectively matches gap support (13,842). The initial retest of this area would be expected to draw buyers.
Widening the view to six months adds perspective.
On this wider view, the Nasdaq continues to trend higher, building on a massive May/June breakout.
By comparison, the summer pullbacks have been shallow, and underpinned by the 20-day moving average (in green), a widely-tracked near-term trending indicator.
The prevailing upturn marks the “expected” follow-through on the Nasdaq’s initial two standard deviation breakout, detailed previously.
Looking elsewhere, the Dow Jones Industrial Average has nailed its range top.
Recall the July peak (34,586) — established this week — has registered within two points of the June peak (34,588).
Conversely, the prevailing range has been underpinned by the 50-day moving average, currently 33,684.
More broadly, the Dow is rising from a head-and-shoulders bottom, defined by the December, March and June lows. This is a high-reliability bullish pattern, laying the groundwork for potentially aggressive upside follow-through.
Meanwhile, the S&P 500 has tagged 14-month highs.
Like the Nasdaq, the S&P’s July price action has been underpinned by the 20-day moving average, a widely-tracked near-term trending indicator.
And here again, the prevailing upturn builds on an aggressive June breakout, detailed previously.
The bigger picture
As detailed above, the major U.S. benchmarks are acting well technically.
On a headline basis, the S&P 500 and Nasdaq Composite have extended summer breakouts, rising to tag 52-week highs. Recent strength marks the “expected” follow-through on each benchmark’s powerful June spike.
Meanwhile, the Dow Jones Industrial Average has nailed its range top, rising amid a backdrop that continues to set up well for longer-term uspide. (See the June 20 review.)
Moving to the small-caps, the iShares Russell 2000 ETF (IWM) has broken out.
The prevailing upturn punctuates a one-month range, underpinned by the 200-day moving average.
From current levels, the breakout point (189.80) pivots to well-defined support.
Meanwhile, the SPDR S&P MidCap 400 ETF (MDY) has extended its recent breakout.
Here again, the prevailing upturn places the mid-cap benchmark at four-month highs.
Combined, the small- and mid-caps have turned higher amid a market strength that continues to broaden.
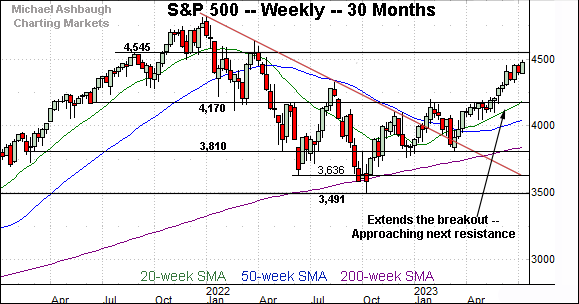
Returning to the S&P 500, this next chart is a weekly view spanning 30 months. Each bar on the chart represents one week.
As illustrated, the S&P has taken flight, rising persistently upon clearing the 4,170 mark. Recall the June low (4,171) matched the inflection point.
More immediately, the S&P’s longer-term target in the 4,545 area — detailed previously — is increasingly within view. (Start with 4,170 - 3,810 = 360. Then, add the result back to the breakout point: 4,170 + 360 = 4,530.)
Narrowing to the S&P 500’s six-month view adds perspective.
As illustrated, the S&P has tagged 14-month highs. The prevailing upturn punctuates an orderly one-month consolidation phase — or sideways chop — hinged to the aggressive early-June spike.
Tactically, the S&P’s upside target — the 4,530-to-4,545 area — is now firmly within striking distance. The pending selling pressure in this area, or lack thereof, may add color.
Conversely, the breakout point (4,458) is followed by the 20-day moving average, currently 4,408.
Delving deeper, the S&P’s former range bottom (4,328) marks an inflection point. An eventual violation would mark a “lower low” opening the path to a less-charted patch, and potential downside follow-through.
As always, it’s not just what the markets do, it’s how they do it. But broadly speaking, a sustained posture atop the 4,325 area signals a comfortably bullish bias.
Also see June 27: Charting a bull-trend pullback, U.S. benchmarks close out strong first-half 2023.
Editor’s Note: The ‘Charting Markets’ summer publishing schedule may be jagged amid multiple projects.


