Charting a bull-bear battle, S&P 500 digests summer breakout
Focus: Dow industrials tag 17-month highs, Crude oil stages trendline breakout
Technically speaking, the major U.S. benchmarks are up on a stilt, of sorts, following a persistent summer rally.
Against this backdrop, each index is near-term extended — and due to consolidate — amid a still comfortably bullish bigger-picture backdrop. The turn-of-the-month price action will likely add color.
Editor’s Note: As always, updates can be directly accessed at https://chartingmarkets.substack.com.
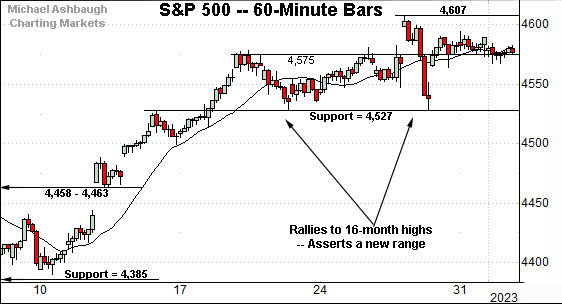
Before detailing the U.S. markets’ wider view, the S&P 500’s hourly chart highlights the past four weeks.
As illustrated, the S&P 500 is digesting a rally to 16-month highs.
Tactically, the prevailing range bottom (4,527) marks initial support and is followed by a deeper floor in the 4,460 area.
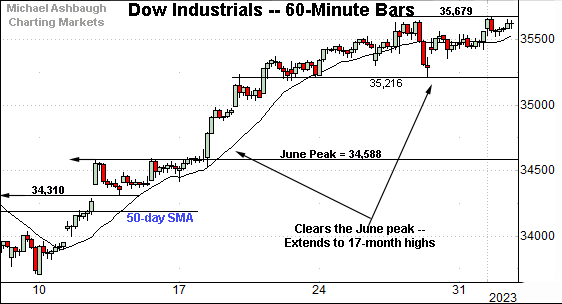
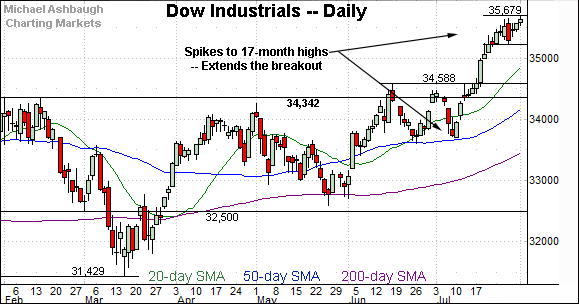
Meanwhile, the Dow Jones Industrial Average has belatedly broken out.
Tactically, recall the June peak (34,588) marked a former sticking point.
The rally atop this area has indeed triggered aggressive upside follow-through, a prospect detailed repeatedly. (See the July 13 review.)
From current levels, the late-July range bottom (35,216) marks a near-term floor.
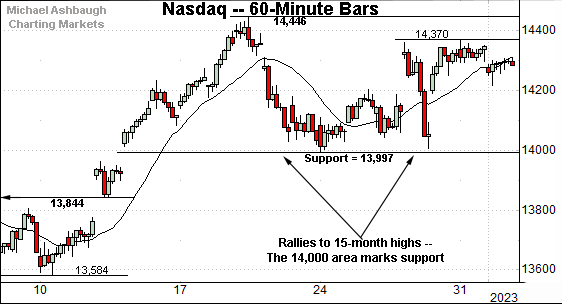
Against this backdrop, the Nasdaq Composite has diverged slightly on this near-term view.
Specifically, the index has registered a “lower high” at the late-July peak, unlike the other major benchmarks. Bullish momentum is waning for the near-term.
Tactically, the 14,000 mark is followed by a deeper floor — the 13,844-to-13,860 area — detailed previously.
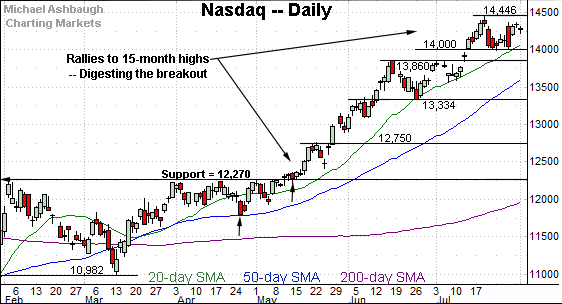
Widening the view to six months adds perspective.
On this wider view, the Nasdaq is digesting a persistent rally to 15-month highs.
The prevailing uptrend has been underpinned by the 20-day moving average (in green) a widely-tracked near-term trending indicator.
Tactically, the 14,000 mark is followed by the breakout point (13,860).
Looking elsewhere, the Dow Jones Industrial Average has finally come to life, staging an aggressive July spike.
Recent strength marks the “expected” upside follow-through, detailed repeatedly. (See the June 27 review.)
More broadly, the breakout punctuates a head-and-shoulders bottom, defined by the December, March and June lows. T
Tactically, the recent range bottom (35,216) marks a near-term floor. (Also see the hourly chart.)
Delving deeper, the 50-day and 200-day moving averages have recently offered support. (See the May and June lows.)
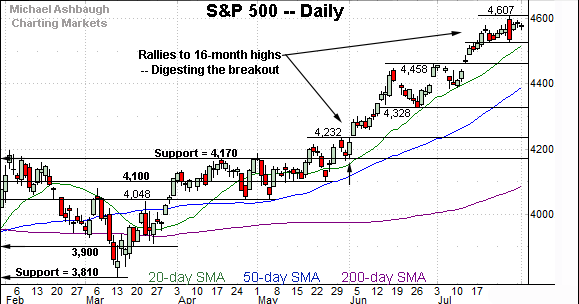
Meanwhile, the S&P 500 has rallied to 16-month highs.
Like the Nasdaq, the S&P’s summer uptrend has been underpinned by the 20-day moving average, currently 4,517, a widely-tracked near-term trending indicator.
The bigger picture
As detailed above, the major U.S. benchmarks have staged a persistent summer rally, rising to tag at least 15-month highs.
Against this backdrop, each index is near-term extended, and due at least a sideways chopping around phase, if not a more pronounced pullback. The turn-of-the-month price action is worth tracking.
More broadly, the U.S. benchmarks’ bigger-picture backdrop remains comfortably bullish.
Moving to the small-caps, the iShares Russell 2000 ETF (IWM) has tagged five-month highs.
Tactically, the prevailing upturn has been capped by next resistance matching the February peak (199.26). The pending selling pressure in this area, or lack thereof, may add color.
More broadly, the recent breakout punctuates a one-month range, underpinned by the 200-day moving average.
Meanwhile, the SPDR S&P MidCap 400 ETF (MDY) remains slightly stronger, briefly tagging 17-month highs.
But here again, the February peak (499.48) has effectively capped the prevailing upturn. The response to this area at the turn of the month is worth tracking.
Returning to the S&P 500, the index is digesting an aggressive summer breakout.
Tactically, recall the June low (4,171) matched the breakout point (4,170) and the S&P has since trended firmly higher.
Amid the upturn, the index has rallied as much as 10.5% — from 4,170 to 4,607 — across about eight weeks. So the prevailing pace is not sustainable for the near-term. A sideways consolidation phase is overdue in the best case.
Against this backdrop, near-term support (4,527) is followed by the breakout point (4,458) a level defining the first-half 2023 peak.
Delving deeper, the 4,460 area is followed by the ascending 50-day moving average, currently 4,394.
As always, it’s not just what the markets do, it’s how they do it. But broadly speaking, the S&P 500’s bigger-picture bias remains bullish barring a violation of these areas.
(On a granular note, the S&P’s prevailing uptrend originates from consecutive tests of the 50-day moving average near the April and May lows. The Dow Jones Industrial Average has more recently registered similar price action near the 50-day moving average.)
Also see July 13: Charting another summer breakout, S&P 500 approaches next target (4,545).
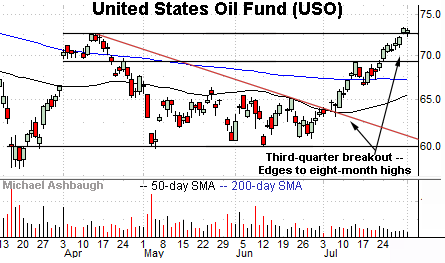
Concluding on a stray note, the United States Oil Fund (USO) tracks the price of light, sweet crude oil.
As illustrated, the shares started July (and the third quarter) with a breakout, clearing trendline resistance tracking the 50-day moving average. The subsequent follow-through has been punctuated by eight-month highs.
Tactically, the former range top (69.10) is followed by the 200-day moving average, currently 67.20. A sustained posture higher signals a comfortably bullish bias.
More broadly, the shares are also well positioned on the weekly and monthly charts, laying the groundwork for potentially material upside follow-through.


