


Charting a technical breakout, Nasdaq approaches major resistance
Focus: Crude oil spikes to 200-day average, 10-year yield violates 200-day average

Technically speaking, the major U.S. benchmarks are starting the second quarter on a largely constructive note.
On a headline basis, each big three benchmark has tagged at least six-week highs, thus far sustaining a recent break atop the 50-day moving average. The charts below add color:
Editor’s Note: As always, updates can be directly accessed at https://chartingmarkets.substack.com.
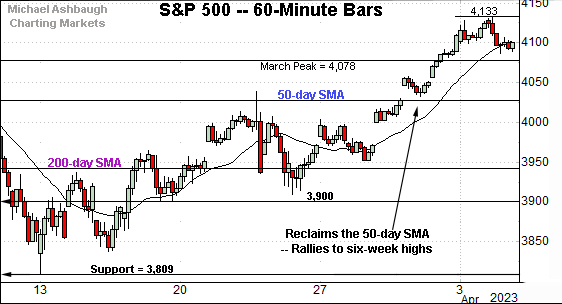
Before detailing the U.S. markets’ wider view, the S&P 500’s hourly chart highlights the past four weeks.
As illustrated, the S&P 500 has extended its rally attempt, tagging six-week highs to start April.
Tactically, the March peak (4,078) is followed by the deeper 50-day moving average, currently 4,027.
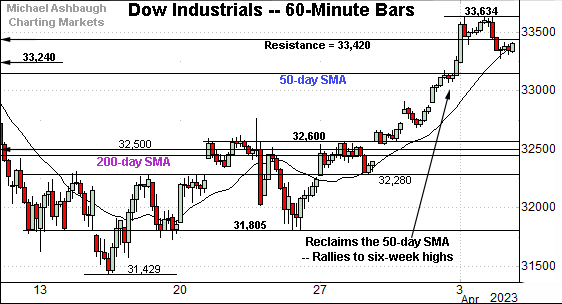
Meanwhile, the Dow industrials have also come to life, rising to tag six-week highs.
The prevailing upturn originates from familiar support — at 31,805 and 32,280 — areas detailed previously.
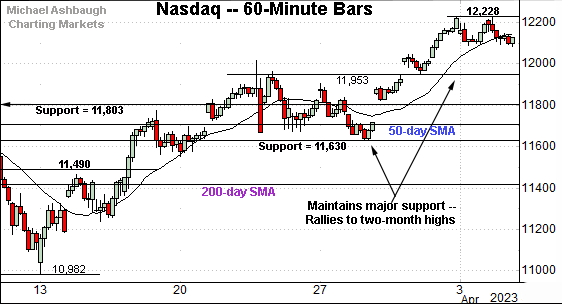
Against this backdrop, the Nasdaq Composite has tagged two-month highs.
Here again, recent follow-through originates from major support (11,630). The late-March low (11,635) registered nearby.
Combined, each big three benchmark is digesting a breakout to start April.
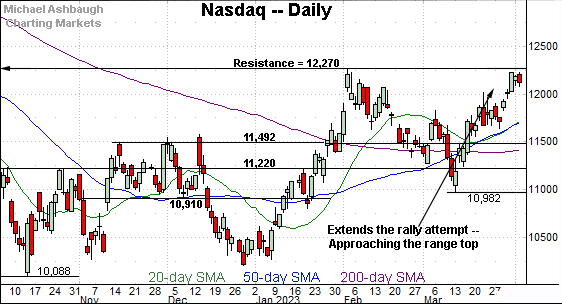
Widening the view to six months adds perspective.
On this wider view, the Nasdaq has extended its rally attempt, rising toward major resistance (12,270).
The specific area matches a seven-month range top defined by the Sept. peak (12,270) and Feb. peak (12,269).
The pending selling pressure in this area, or lack thereof, will likely add color. As always, the chances of a breakout improve to the extent an index holds relatively tightly to resistance.
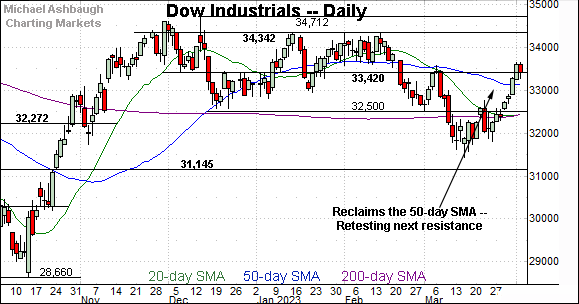
Looking elsewhere, the Dow Jones Industrial Average has reversed course, rising back to its former range.
In the process, the index has reclaimed its breakdown point (32,500) as well as the 50- and 200-day moving averages.
Tactically, the prevailing backdrop supports a bullish bigger-picture bias barring a violation of the 32,440-to-32,500 area.
More immediately, the 33,420 area marks a nearby inflection point.
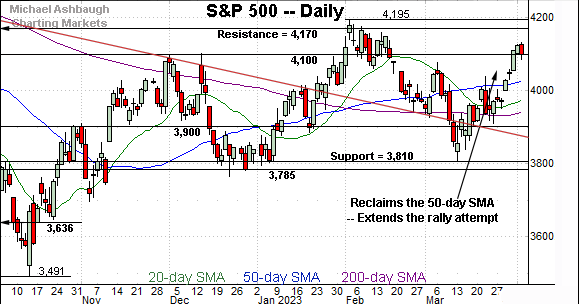
Similarly, the S&P 500 has tagged six-week highs.
The prevailing upturn places the index back atop the 50-day moving average, currently 4,027, an area that previously capped the rally attempt.
The bigger picture
As detailed above, the major U.S. benchmarks are starting the second quarter on a largely constructive note.
Each big three benchmark has tagged six-week highs, sustaining a recent break atop the 50-day moving average. (See the hourly charts.)
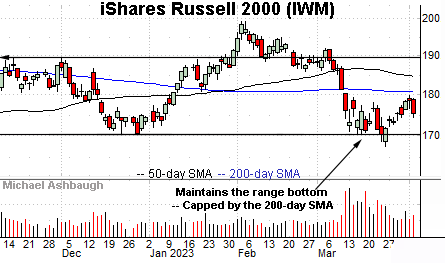
Moving to the small-caps, the iShares Russell 2000 ETF (IWM) remains range-bound.
Recall the index has maintained major support, an area matching the Dec. low (170.34).
Nonetheless, the recent rally attempt has been fueled by decreased volume, and capped by the 200-day moving average, currently 180.95. Eventual downside follow-through remains a prospect based on today’s backdrop.
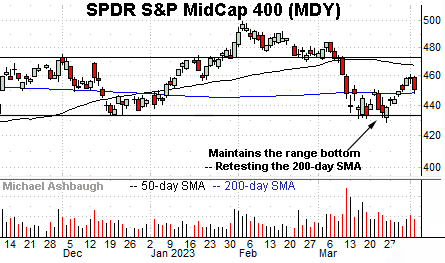
Similarly, the SPDR S&P MidCap 400 ETF (MDY) remains range-bound following an extended March test of major support.
More immediately, the mid-cap benchmark has whipsawed at the 200-day moving average, currently 448.40.
Market bears might point to a developing head-and-shoulders top defined by the December, February and April peaks. Each registered at the turn of the month.

Returning to the S&P 500, the index has extended a jagged rally attempt.
The prevailing upturn originates from major support (3,810) and has subsequently tagged the 4,100 mark. Combined, the S&P has ratted its late-2022 range, and near-term caution is likely warranted near the range top.
Beyond specific levels, the rally attempt continues to get mixed marks for style (at best) as measured by volume, breadth and sector particpation.
(On a granular note, Apple and Microsoft combine for a 12% S&P 500 weighting. So of the 500 companies in the S&P 500, Apple and Microsoft are masking weakness elsewhere. Recall Microsoft’s backdrop, detailed March 29.)
But reservations aside, the S&P 500’s price action remains sufficient to support a guardedly-bullish bigger-picture bias.
Tactically, the S&P’s 50-day moving average, currently 4,027, marks a downside inflection point.
Delving deeper, the S&P 3,940 area remains a bull-bear fulcrum matching two inflection points:
The 200-day moving average, currently 3,941.
The mid-point of the prevailing range (3,942).
As always, it’s not just what the markets do, it’s how they do it. But generally speaking, the S&P 500’s recovery attempt is intact barring a violation of the 3,940 area.
Editor’s Note: Tuesday’s review was held up by technology issues. The next review will be published Wednesday, April 12.
Watch List
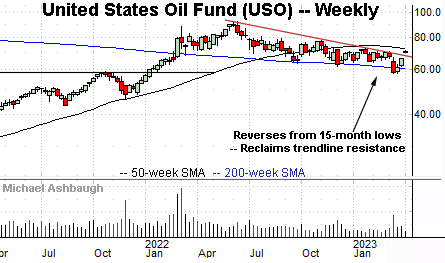
Drilling down further, the United States Oil Fund (USO) — profiled last week — has taken flight, rising after OPEC+ announced an unexpected production cut.
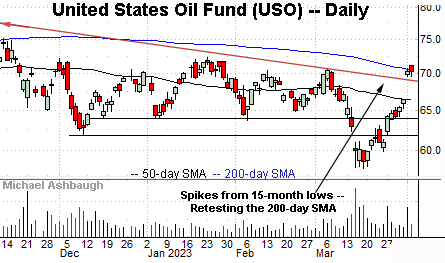
In the process, the shares have gapped atop trendline resistance, rising to challenge the 200-day moving average, currently 70.45.
Tactically, gap support (69.60) roughly matches the trendline and is followed by the deeper 50-day moving average. The prevailing rally attempt is intact barring a violation.
More broadly, the shares have weathered a brief venture under the 200-week moving average, averting potentially consequential downside follow-through. (See the weekly chart.)
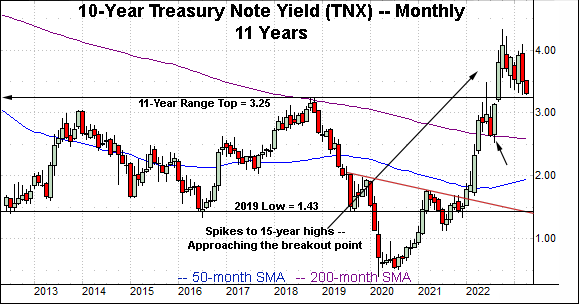
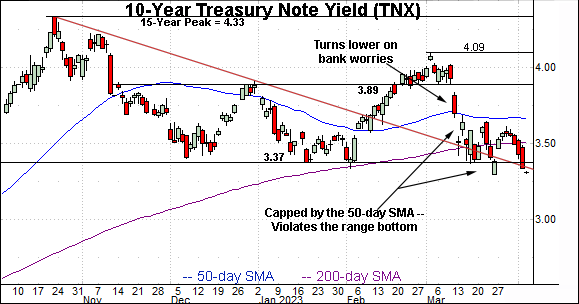
Meanwhile, the 10-year Treasury note yield (TNX) is pressing notable downside levels. Three areas stand out:
The six-month range bottom (3.37).
Trendline support.
The 11-year breakout point (3.25) detailed on the monthly chart.
Against this backdrop, Tuesday’s close (3.33) marked a six-month closing low, the lowest close since Sept. 9.
The pending downside follow-through, or lack thereof, will likely add color. Broadly speaking, the yield’s longer-term bias remains range-bound to higher barring a violation of the breakout point (3.25).
Summing up the cross currents — Rising energy prices and easing interest rates
Collectively, energy prices and Treasury yields have started April, and the second quarter, amid notable price action. On a headline basis, the 10-year yield has violated its 200-day moving average, while crude-oil prices have spiked to challenge the 200-day moving average. (See the daily charts.)