Charting a dead-cat bounce: S&P 500 fails second test of breakdown point (4,372)
Focus: Volatility Index (VIX) signals stubborn complacency, Nasdaq nails major support (14,175) and attempts to rally
U.S. stocks are lower early Wednesday, pressured amid concerns over signs of an emerging stagflationary economic backdrop.
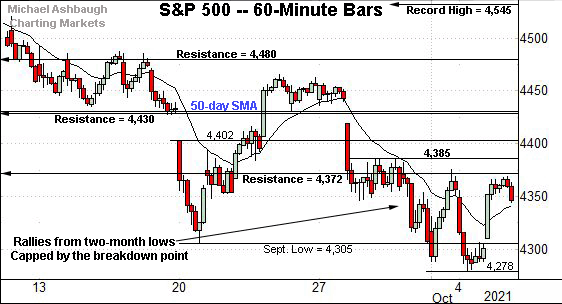
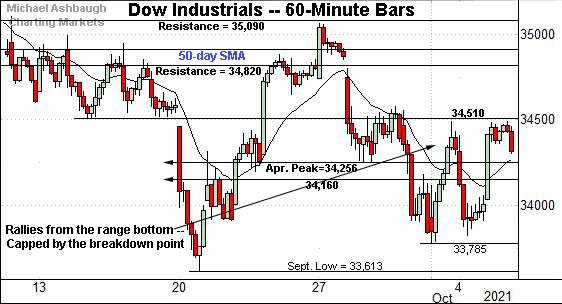
Against this backdrop, the S&P 500 and Dow industrials have failed a second October test of their respective breakdown points — S&P 4,372 and Dow 34,510 — areas detailed previously as key bull-bear inflection points.
The week-to-date peaks — S&P 4,369 and Dow 34,490 — have registered slightly under resistance, and selling pressure has surfaced.
Editor’s Note: As always, updates can be directly accessed at chartingmarkets.substack.com.
Before detailing the U.S. markets’ wider view, the S&P 500’s hourly chart highlights the past four weeks.
As illustrated, the S&P has asserted a lower plateau, for the time being, capped by the breakdown point (4,372).
The early-October peaks — Friday (4,375) and Tuesday (4,369) — have closely matched major resistance, and selling pressure has surfaced.
Similarly, the Dow Jones Industrial Average remains capped by its breakdown point (34,510).
Here again, the early-October peaks — Friday (34,990) and Tuesday (34,991) — have roughly matched major resistance.
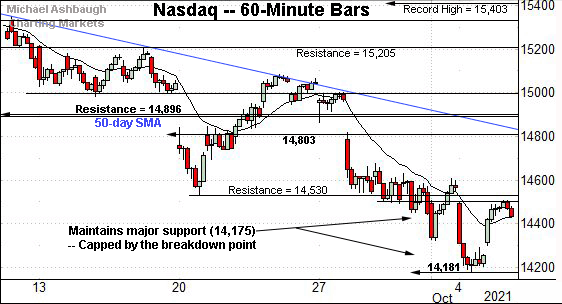
Meanwhile, the Nasdaq Composite has established the weakest near-term backdrop.
As illustrated, the index has asserted a posture under the mid-September low (14,530) exhibiting relative weakness versus the other benchmarks.
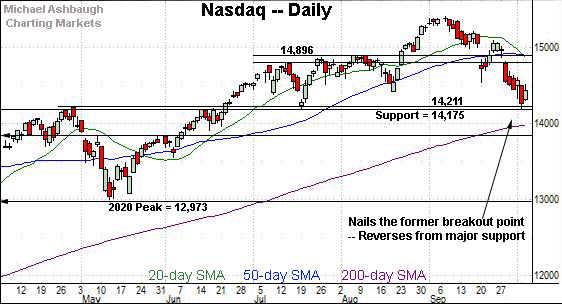
But perhaps more notably, the index has also maintained major support (14,175), an area detailed repeatedly, and also illustrated on the daily chart below. (See for instance, the Sept. 29 review.)
The week-to-date low (14,181) — also the October low — has closely matched support.
Widening the view to six months adds perspective.
On this wider view, the Nasdaq has staged a successful test of its breakout point (14,175).
To reiterate, the early-week low (14,181) registered nearby, and the index subsequently turned higher.
Tactically, the quality of the prevailing rally attempt — which has thus far been uninspiring — should be a useful bull-bear gauge. Recall the index has initially stalled near first resistance in the 14,500-to-14,530 area, illustrated on the hourly chart.
On further weakness, the 200-day moving average, currently 13,984, is rising toward major support.
More broadly, the Nasdaq’s intermediate-term bias remains bearish pending a reversal back atop the 14,800 area.
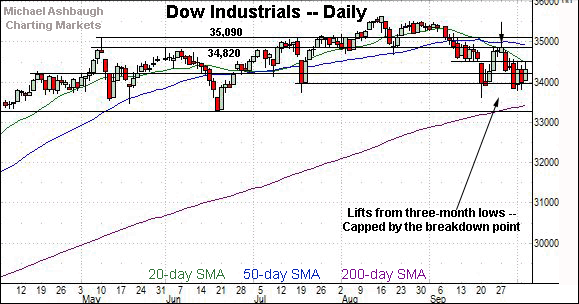
Looking elsewhere, the Dow Jones Industrial Average is off to a comparably flattish October start.
The blue-chip benchmark has not registered a “lower low” versus the September low, outpacing the other benchmarks.
Still, the index has registered consecutive failed tests of major resistance — around 34,820 and 34,510 — areas also detailed on the hourly chart. Bearish price action.
Also recall the Dow previously paced the broad-market downturn, asserting a bearish bias on Sept. 10, before the other benchmarks.
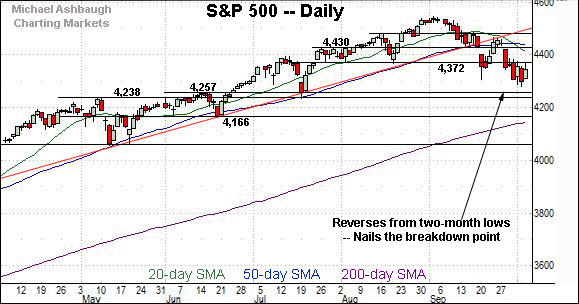
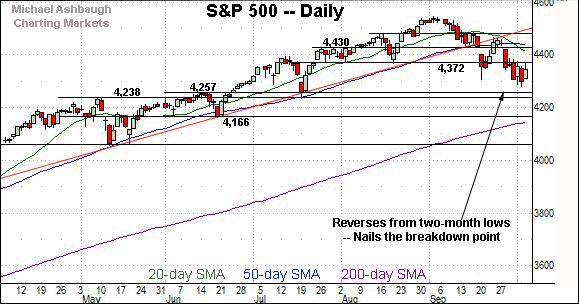
Meanwhile, the S&P 500 has effectively nailed its breakdown point (4,372) from underneath.
To reiterate, Tuesday’s session high (4,369) registered just under resistance, and selling pressure has subsequently resurfaced. Bearish price action.
The bigger picture
As detailed above, the U.S. benchmarks’ intermediate-term bias remains bearish amid a shaky October start.
On a headline basis, the S&P 500 and Dow industrials have once again failed tests of their breakdown points — S&P 4,372 and Dow 34,510 — and respectable selling pressure has resurfaced. (See the hourly charts.)
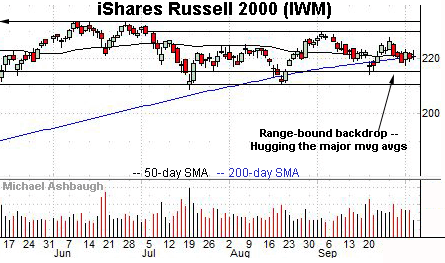
Moving to the small-caps, the iShares Russell 2000 ETF continues to exhibit relative strength versus the major U.S. benchmarks.
Still, the prevailing backdrop does not exactly scream “raging bull.” The small-cap benchmark has hugged its 50- and 200-day moving averages amid a flat October start.
Tactically, an eventual violation of the range bottom — roughly, the August low (210.68) — remains a technical “watch out.” Such a move would likely signal a primary trend shift.
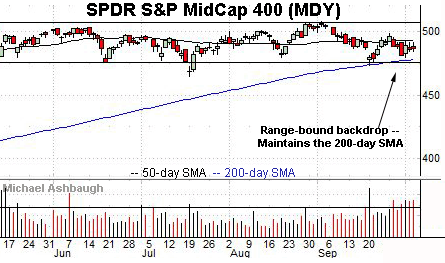
Meanwhile, the SPDR S&P MidCap 400 ETF remains range-bound, but capped by the 50-day moving average.
Tactically, the 200-day moving average, currently 478.08, and September low (473.40) mark important downside inflection points.
The MDY has tested its 200-day early Wednesday. The session close may add color.
(On a granular note, see the recent sustained volume surge as the MDY vies to maintain its range bottom.)
Looking elsewhere, the SPDR Trust S&P 500 ETF has asserted a downtrend initially flagged last week.
Against this backdrop, recent downturns have been fueled by increased volume, and punctuated by a lighter-volume intervening rally attempt.
Also see the failed test of trendline resistance from underneath followed by Tuesday’s failed test of the breakdown point. Bearish price action.
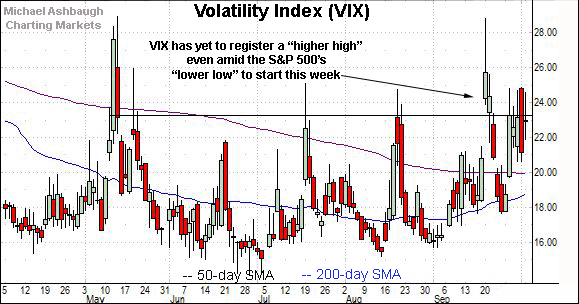
Moving to market sentiment, the prevailing backdrop remains bearish as measured by the Volatility Index (VIX).
Recall the S&P 500 registered a “lower low” Monday on an intraday, and closing, basis.
Meanwhile, the VIX has not yet tagged a corresponding “higher high” leaving the S&P 500 vulnerable to incremental downside from current levels. (See Friday’s review for added Volatility Index detail.)
More broadly, the S&P 500 is digesting a massive 11-month, 38.6% rally from the November 2020 low — (just before the U.S. election) — to the September 2021 peak.
A long overdue consolidation phase is currently underway.
Returning to the S&P 500’s six-month view, the index has failed consecutive tests of key resistance.
Recall the downturn from trendline resistance, followed by the October peaks, closely matching the breakdown point (4,372).
Combined, the failed trendline test — and subsequent “lower low” — signal a still bearish intermediate-term bias.
Delving deeper, major support spans from 4,238 to 4,257, levels matching the May and mid-June peaks. The July closing low (4,258) matched major support. (Also see the 30-month chart.)
Conversely, familiar resistance spans from 4,372 to 4,385.
Tactically, a sustained rally atop this area would mark an early step toward stabilization.
On further strength, the 50-day moving average, currently 4,437, is now descending toward resistance. Eventual follow-through atop the 50-day moving average would more firmly signal a bullish intermediate-term trend shift.
As always, it’s not just what the markets do, it’s how they do it. The pending response to several technical levels, detailed above, may add color.


