Charting the (potential) end of the pandemic bull run: S&P 500 asserts downtrend
Focus: Volatility Index (VIX) signals complacency as S&P 500 consolidates nearly 40% 11-month run
U.S. stocks are higher mid-day Friday, rising to start the fourth quarter in the wake of ugly September price action.
Against this backdrop, the S&P 500 is rising from two-month lows amid bigger-picture technicals that continue to support a bearish intermediate-term bias.
Editor’s Note: As always, updates can be directly accessed at chartingmarkets.substack.com.
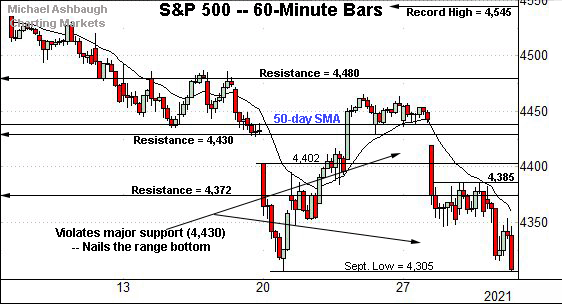
Before detailing the U.S. markets’ wider view, the S&P 500’s hourly chart highlights the past four weeks.
As illustrated, the S&P concluded September — and the third quarter — on a bearish note.
Consider that Thursday’s session low (4,306) effectively matched the range bottom (4,305) amid a respectable final-hour downdraft.
More immediately, the index briefly tagged two-month lows early Friday.
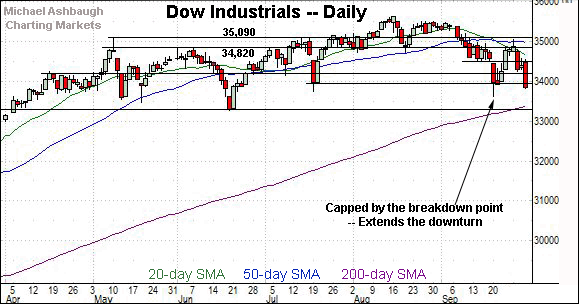
Meanwhile, the Dow Jones Industrial Average has not quite reached its range bottom.
Still, the index has reversed 1,200+ points from its early-week peak (35,061).
The downturn places the Dow under its April peak (34,256) a recent bull-bear inflection point.
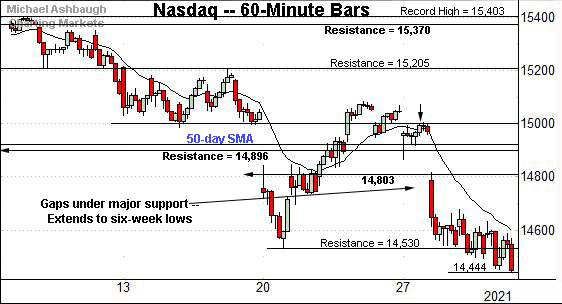
Against this backdrop, the Nasdaq Composite has violated its range bottom.
Recent follow-through builds on an early-week gap under the 50-day moving average, and the breakdown point (14,896). Both areas are detailed below.
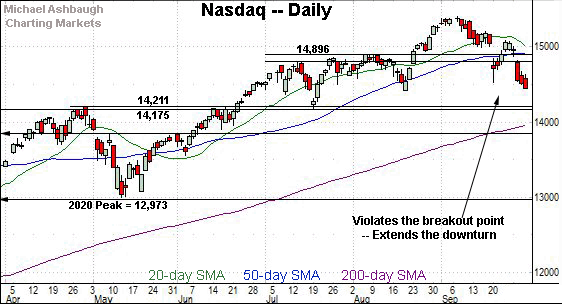
Widening the view to six months adds perspective.
On this wider view, the Nasdaq has tagged six-week lows, placing distance under its 50-day moving average and the former breakout point (14,896).
Tactically, the prevailing backdrop supports a bearish intermediate-term bias pending a sustained rally back atop the 14,900 area.
Delving deeper, the August low (14,423) is followed by major support broadly spanning from 14,175 to 14,211.
Looking elsewhere, the Dow Jones Industrial Average has tagged a three-month closing low.
The prevailing downturn punctuates a failed test of the breakdown point (34,820) from underneath. (Also recall the late-September peak (35,061) registered slightly under major resistance.)
Delving deeper, the marquee 200-day moving average, currently 33,379, is followed by the five-month range bottom — the 33,272-to-33,290 area.
An eventual violation of this area would raise a technical red flag, signaling a bearish longer-term bias.
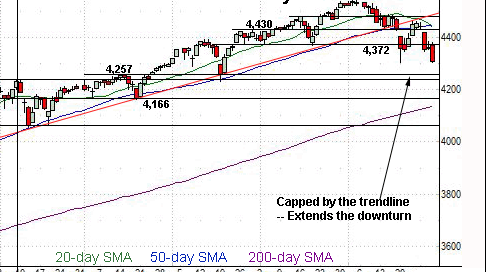
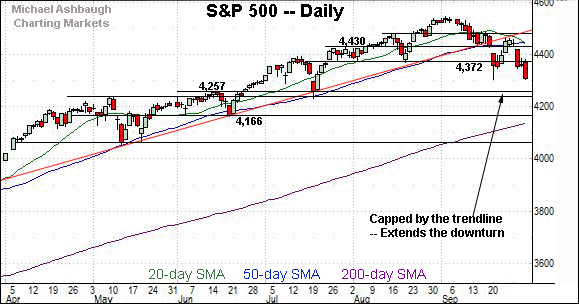
Meanwhile, the S&P 500 has extended its downturn from trendline resistance.
In the process, the September close (4,307) — also the third-quarter close — marked a two-month closing low.
Combined, the failed test of trendline resistance, and subsequent lower low, signal an intermediate-term downtrend.
The bigger picture
Collectively, the major U.S. benchmarks’ intermediate-term bias remains bearish pending repairs.
On a headline basis, each index concluded September with a new closing low, placing distance under key technical levels, detailed on the daily charts.
Moving to the small-caps, the iShares Russell 2000 ETF has strengthened versus the major U.S. benchmarks.
Though a retest of the 200-day moving average remains underway, the small-cap benchmark continues to trade comfortably atop the August low.
Note carefully, an eventual violation of the range bottom — roughly, the August low (210.68) — would raise a major technical red flag.
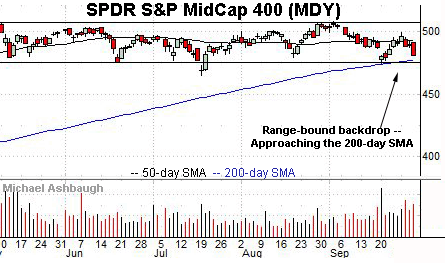
Similarly, the SPDR S&P MidCap 400 ETF remains range-bound.
Tactically, the 200-day moving average, currently 477.06, and the September low (473.40) mark important downside inflection points.
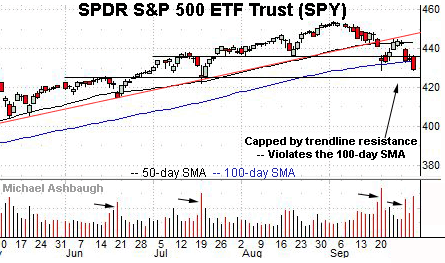
Looking elsewhere, the SPDR Trust S&P 500 ETF has pulled in from trendline resistance, pressured amid a sustained volume increase.
The downturn places the SPY under its 100-day moving average, currently 433.65, for the first time since early-November 2020. (Since just before the U.S. election.)
Revisiting generally bearish (but slightly conflicting) market breadth signals
Despite the SPY’s volume spikes, this week’s downside internal strength has registered as lukewarm.
As context, recall the mid-September gap lower was fueled by greater than 8-to-1 negative breadth. (Put differently, NYSE declining volume surpassed advancing volume by an 8-to-1 margin.)
By comparison, this week’s strong-volume downturns have registered as softer, on the order of 4-to-1, and 2-to-1, down days.
As always, in a textbook world, two 9-to-1 down days — across about a seven-session window — would reliably signal a major trend shift.
Friday marks “Day 10” and the textbook downside follow-through has yet to register. (To perhaps state the obvious, market price action is almost always not quite textbook.)
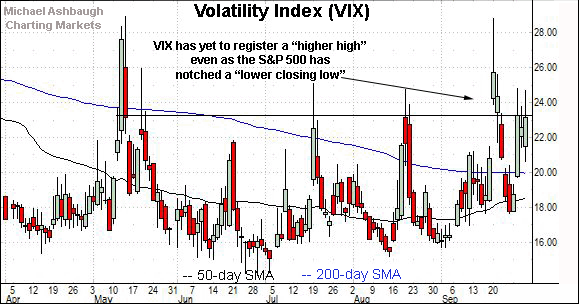
Moving to market sentiment, the prevailing backdrop remains bearish as measured by the Volatility Index (VIX), broadly speaking a market-fear gauge.
Extreme VIX highs signal excessive fear, consistent with durable S&P 500 lows.
Conversely, extreme VIX lows signal investor complacency, consistent with S&P 500 tops.
Against the current backdrop, the S&P 500 has registered two-month closing lows across two of the prior three sessions.
This means the VIX “should” be registering — or at least nearing — two-month highs.
But the VIX has not yet registered new highs, signaling that the S&P 500 likely has further downside ahead before it establishes a durable low.
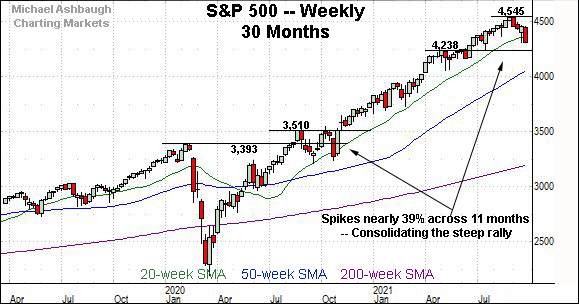
Returning to the S&P 500, the chart above is a weekly view spanning 30 months. Each bar on the chart represents one week.
Consider that from the November 2020 low (3,279) to the September peak (4,545) the S&P has rallied 38.6% across just 11 months.
Put differently, just under 40% of the S&P 500’s value — it’s total value, across history — has registered in less than one year.
Market bears might contend that a return on this order, amid pandemic-ish conditions, fits the description of “too far, too fast.” Time will tell.
Tactically, major support spans from 4,238 to 4,257, an area also detailed below.
(On a granular, and much broader note, the 38% Fibonacci retracement of the entire pandemic rally — from the 2020 low to the 2021 peak — rests at S&P 3,646.)
Returning to the S&P 500’s six-month view, the index has asserted a downtrend.
To reiterate, the mid-September trendline breakdown was fueled by unusually bearish 8-to-1 negative breadth.
By comparison, the subsequent rally attempt registered as lackluster, stalling near trendline resistance.
The subsequent downturn from the trendline has been punctuated by a “lower low.” Combined, the S&P’s failed trendline test and recent series of “lower lows” signals an intermediate-term downtrend.
Separately, the 50-day moving average’s slope has also turned nominally lower, consistent with a downtrend.
Tactically, major support spans from 4,238 to 4,257, levels matching the May and mid-June peaks. Recall the July closing low (4,258) matched major support, to punctuate a successful retest, and subsequent rally to record highs. (See the July 20 review.)
Conversely, notable S&P resistance spans from 4,372 to 4,385. A relatively swift reversal atop this area would mark an early step toward stabilization.
As always, it’s not just what the markets do, it’s how they do it. The next several sessions, as the fourth quarter gets underway, may add color.

