Charting a bearish Q4 start: S&P 500 nails the breakdown point (4,372)
Focus: Crude-oil prices continue to take flight, Sector cross currents persist, USO, XLE, XLF, SMH, TRAN, XLI
U.S. stocks are firmly lower Monday, pressured amid a bearish fourth-quarter start.
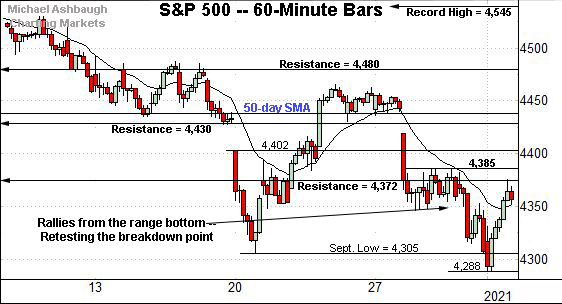
Against this backdrop, the S&P 500 is challenging two-month lows, pressured in the wake of Friday’s failed test of the breakdown point (4,372) from underneath.
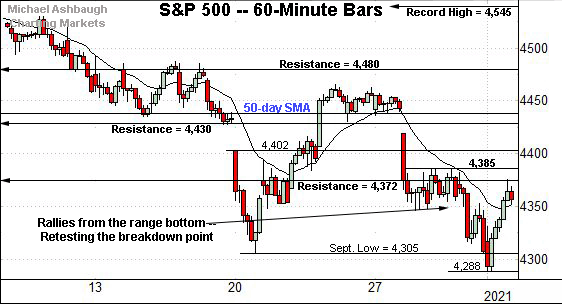
Before detailing the U.S. markets’ wider view, the S&P 500’s hourly chart highlights the past four weeks.
As illustrated, the S&P has failed consecutive tests of the breakdown point (4,372) from underneath.
Friday’s session high (4,375) registered nearby, and the index is firmly lower early Monday. Bearish price action.
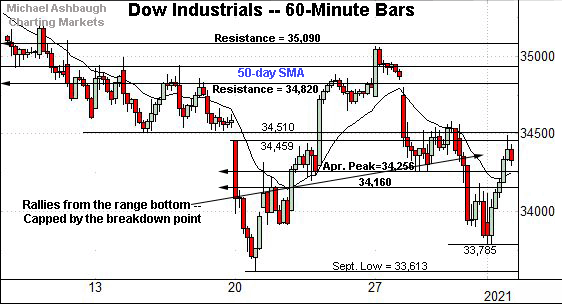
Similarly, the Dow Jones Industrial Average has failed recent retests of its breakdown point (34,510).
Here again, Friday’s session high (34,990) registered within view, and has been punctuated by Monday’s early selling pressure.
On a slightly positive note, the Dow was the only major U.S. benchmark not to register a “lower low” last week.
(But also recall the Dow had paced the prevailing leg lower, asserting a bearish bias on Sept. 10, before the other benchmarks.)
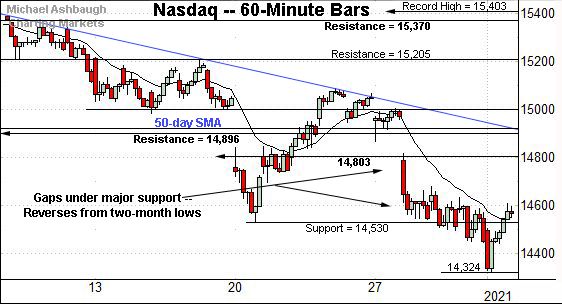
Against this backdrop, the Nasdaq Composite continues to underperform for the near-term.
Though the index reversed modestly from two-month lows, it has yet to challenge material resistance.
(By comparison, the S&P 500 and Dow industrials both rallied to at least test their respective breakdown points.)
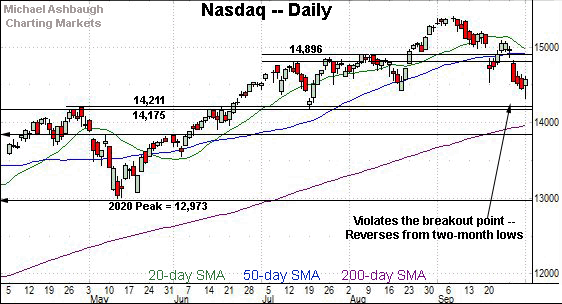
Widening the view to six months adds perspective.
On this wider view, the Nasdaq briefly tagged two-month lows last week. The index is firmly back on the defensive early Monday.
As detailed previously, important support broadly spans from 14,175 to 14,211, levels matching the February and April peaks.
This area — the 14,175-to-14,211 area — defines the breakout point from a major double bottom, defined by the March and May lows.
(On a granular note, an upside target projected from the double bottom to 15,420, a level that would roughly match what remains the Nasdaq’s all-time high (15,403).)
Delving slightly deeper, the 200-day moving average, currently 13,967, is rising toward major support.
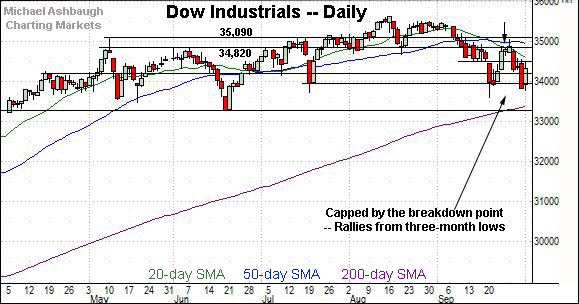
Looking elsewhere, the Dow Jones Industrial Average tagged a three-month closing low last week.
Recall the prevailing downturn punctuates a failed test of the breakdown point (34,820) from underneath.
More immediately, the Dow’s most recent rally attempt has also been capped by a breakdown point (34,510). The consecutive failed tests of resistance are bearish. (Also see the hourly chart.)
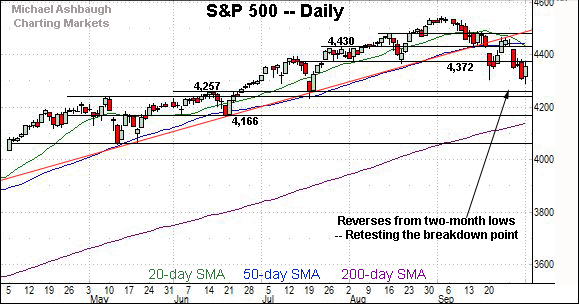
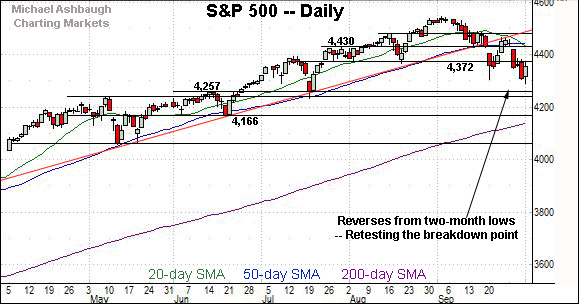
Meanwhile, the S&P 500 has failed its initial test of the breakdown point (4,372) from underneath.
To reiterate, Friday’s session high (4,375) registered nearby, and has been punctuated by Monday’s early downside follow-through. Bearish price action.
The bigger picture
As detailed above, the U.S. benchmarks’ intermediate-term bias remains bearish pending repairs.
On a headline basis, the S&P 500 and Dow industrials concurrently failed tests of their respective breakdown points to conclude last week — S&P 4,372 and Dow 34,510. Each index has subsequently drawn respectable selling pressure early Monday.
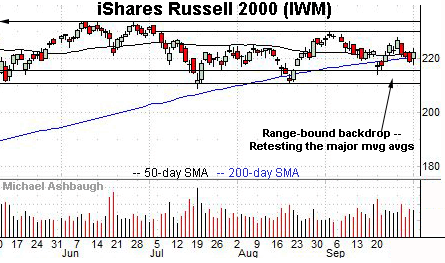
Moving to the small-caps, the iShares Russell 2000 ETF remains relatively stronger than the major U.S. benchmarks.
Range-bound price action is constructive against the current backdrop.
Tactically, an eventual violation of the range bottom — roughly, the August low (210.68) — remains a technical “watch out.” Such a move would mark a material “lower low” raising a red flag.
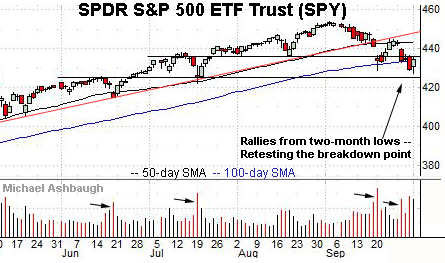
Looking elsewhere, the SPDR Trust S&P 500 ETF continues to broadly trend lower, pressured amid a sustained volume increase.
Against this backdrop, the SPY has ventured under its 100-day moving average, currently 433.90, for the first time since early-November 2020. An extended retest remains underway.
Placing a finer point on the S&P 500, the index has stalled at its breakdown point (4,372) an area detailed repeatedly.
Recall Friday’s session high (4,375) roughly matched resistance to punctuate a consecutive failed retest of this area. Bearish price action.
More broadly, the S&P 500 confirmed its intermediate-term downtrend last week.
Tactically, the mid-September trendline breakdown — fueled by aggressive 8-to-1 negative breadth — has been punctuated by a corrective bounce, and failed test of the trendline from underneath.
More immediately, the subsequent downside follow-through — the selloff from the trendline — has been punctuated by a “lower low.”
So combined, the September trendline breakdown, and October downside follow-through, signal a still bearish intermediate-term bias.
Delving deeper, major support spans from 4,238 to 4,257, levels matching the May and mid-June peaks. The July closing low (4,258) matched major support to punctuate a successful retest, and subsequent rally to record highs. (See the July 20 review.)
Conversely, notable S&P resistance rests in the 4,372-to-4,385 area, detailed Friday. A sustained rally atop this area would mark technical progress.
Beyond technical levels, the prevailing fourth-quarter start, and the pending response to October earnings season, will likely add color.
Watch List
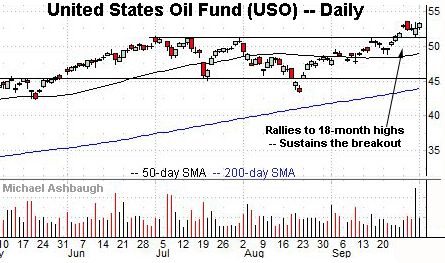
Drilling down further, the United States Oil Fund has sustained its breakout amid the prevailing stock-market downturn. The fund tracks the spot price of light, sweet crude oil.
Late last month, the shares knifed to 18-month highs, clearing a well-defined range top.
The subsequent flag pattern has been underpinned by the breakout point (51.40) positioning the shares to extend the uptrend.
As detailed repeatedly, the prevailing upturn opens the path to a much less-charted patch, opening the path to potentially material upside follow-through.
Tactically, the March 2020 gap (58.64) — about 10.1% above currents levels — marks the next potential stop. (Also see the Sept. 17 and Sept. 24 reviews.)
Charting market rotation — Pockets of strength persist
Moving U.S. sectors, familiar pockets of strength have sustained a recent resurgence amid rotational turn-of-the-quarter price action:
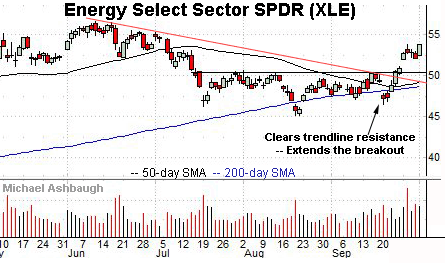
To start, the Energy Select Sector SPDR has sustained a trendline breakout, initially detailed Sept. 24.
Recent follow-through punctuates a head-and-shoulders bottom defined by the July, August and September lows.
More immediately, the prevailing bull flag — the relatively tight one-week range — is a bullish continuation pattern.
Separately, the very early October upturn punctuates a “higher high” confirming the group’s September trend shift. Tactically, the former range top (53.20) is followed by gap support (51.95).
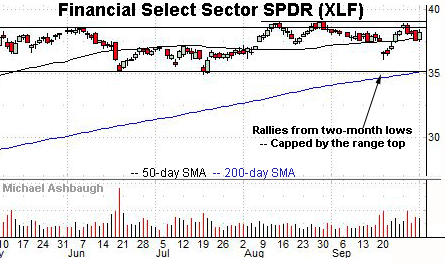
Meanwhile, the Financial Select Sector SPDR remains relatively resilient amid pronounced weakness elsewhere.
As illustrated, the group reversed respectably from the mid-September downdraft, rising to briefly challenge record highs.
The group has subsequently maintained its 50-day moving average, currently 37.77, a familiar bull-bear inflection point.
Fundamentally, surging Treasury yields have contributed to the group’s recent relative strength.
Pockets of relative weakness persist amid market rotation
Conversely, the prevailing market volatility spike continues to inflict potentially consequential sub-sector damage. Three groups exemplify the prevailing backdrop:
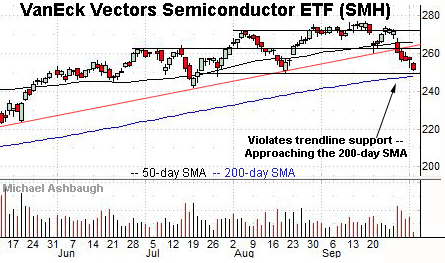
To start, the VanEck Vectors Semiconductor ETF has turned lower.
As illustrated, the group’s recent trendline violation has been fueled by a sustained volume increase, signaling a bearish intermediate-term bias.
Tactically, a reversal back atop the breakdown point, circa 262.00, would place the brakes on bearish momentum.
Conversely, important support matches the August low (249.35) and the 200-day moving average, currently 247.67.
An eventual violation of this area would signal a primary trend shift, raising a technical red flag. (Also see the modified double top defined by the August and September peaks.)
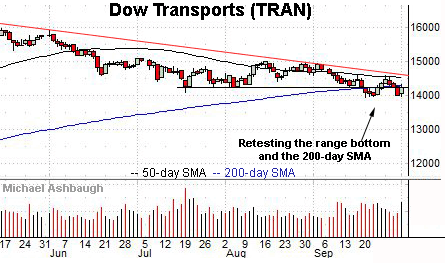
Meanwhile, the Dow Transports remain tenuously positioned.
As illustrated, the group continues to challenge a five-month range bottom (14,243) and the 200-day moving average, currently 14,300.
Recent weakness punctuates a failed test of trendline resistance roughly tracking the 50-day moving average.
Tactically, eventual follow-through under the September low (13,946) would confirm the group’s downtrend, opening the path to potentially material incremental downside.
Recall sector bellwether FedEx Corp.’s recent earnings-fueled plunge has pressured the group.
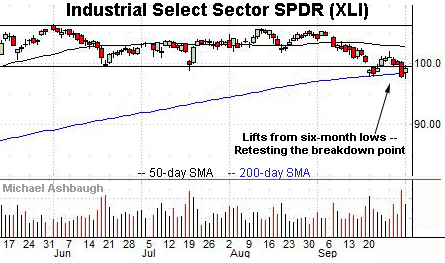
Finally, the Industrial Select Sector SPDR has tagged six-month lows amid an extended test of the 200-day moving average, currently 98.47.
Slightly more broadly, recent downdrafts have been fueled by increased volume, and punctuated by a lighter-volume intervening rally attempt. Bearish price action.
Tactically, an eventual violation of the October low (97.48) would likely raise a technical red flag.
Summing up the backdrop
Collectively, the recent market price action remains rotational amid shifting sector leadership.
Still, the prevailing rotation toward smaller sectors — (particularly energy) — leaves the bigger-picture backdrop prone to incremental deterioration, as detailed last week.
The prevailing fourth-quarter start, and the pending response to October earnings season, will likely add color.


