Bearish momentum persists: S&P 500 balks at trendline resistance
Focus: Surging Treasury yields and Energy prices persist, Natural gas takes flight, Health care sector turns lower, TNX, UNG, KRE, XLE, QQQ, XLP, XLV
U.S. stocks are mixed early Wednesday, vacillating as market cross currents persist.
Against this backdrop, the S&P 500 and Nasdaq Composite have re-violated key technical levels, pressured to punctuate failed tests of trendline resistance. Each benchmark has asserted a bearish intermediate-term bias pending repairs.
Before detailing the U.S. markets’ wider view, the S&P 500’s hourly chart highlights the past four weeks.
As illustrated, the S&P has re-violated two important technical levels.
The specific areas match the 50-day moving average, currently 4,445, and the breakdown point (4,430).
In the process, the S&P narrowly registered a two-month closing low Tuesday (4,352) by a less than two-point margin. Bearish price action.
Meanwhile, the Dow Jones Industrial Average has also reversed course.
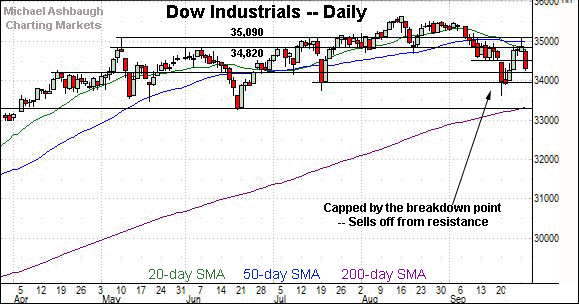
The downturn places the index under its breakdown point (34,820), an area also detailed on the daily chart.
Conversely, recall the April peak (34,256) marks an inflection point.
Tuesday’s session low (34,254) registered nearby. (See Friday’s review.)
Against this backdrop, the Nasdaq Composite has pulled in more aggressively.
The downturn places the index back under the 50-day moving average, and the breakdown point (14,896), familiar bull-bear inflection points. Both areas are detailed below.
Separately, consider that Tuesday’s session low (14,539) registered slightly above the September low (14,530). Shaky price action.
Widening the view to six months adds perspective.
On this wider view, the Nasdaq has re-violated its 50-day moving average and the former breakout point (14,896). The downturn has been punctuated by a six-week closing low.
Tactically, the Nasdaq’s intermediate-term bias remains bearish pending a sustained reversal atop the 14,900 area.
Delving deeper, the August low (14,423) is followed by major support broadly spanning from 14,175 to 14,211.
(Also see the QQQ’s backdrop, in the next section, exemplifying the recent trendline breakdown.)
Looking elsewhere, the Dow Jones Industrial Average has failed its initial retest of the breakdown point (34,820) from underneath.
Separately, the week-to-date peak (35,061) has registered slightly under major resistance (35,090) and subsequently drawn selling pressure.
The prevailing downturn preserves a bearish intermediate-term bias, initially signaled on Sept. 10.
Meanwhile, the S&P 500 has stalled near trendline resistance, a level also detailed on the SPY’s chart in the next section.
The prevailing downturn has been punctuated by a two-month closing low (4,352), though by a narrow two-point margin. Shaky price action nonetheless.
The bigger picture
Collectively, the major U.S. benchmarks have asserted a bearish intermediate-term bias pending repairs.
Though the bigger-picture backdrop remains slightly uneven, each index has staged a sluggish late-September rally attempt, punctuated by Tuesday’s aggressive downdraft back below key technical levels.
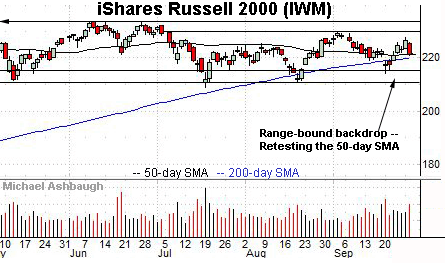
Moving to the small-caps, the iShares Russell 2000 ETF has strengthened versus the major U.S. benchmarks.
As illustrated, the small-cap benchmark has maintained a posture comfortably atop the August low.
Fundamentally, the financials represent the second-largest Russell 2000 sector weighting behind health care. The group’s recent resurgence has contributed to the small-cap benchmark’s relative strength.
Looking elsewhere, the SPDR Trust S&P 500 ETF has balked at trendline resistance.
Consider that the September downturn — signaling a trend shift — has been punctuated by tandem volume spikes.
Also recall that the initial downdraft — (the mid-September downturn) — was fueled by greater than 8-to-1 negative breadth.
By comparison, the intervening rally attempt has been fueled by decreased volume, and lackluster internal strength.
(On a granular note, Tuesday’s sharp downturn was fueled by nearly 4-to-1 negative breadth on both the NYSE and Nasdaq. So the potential second shoe to drop — a second 8-to-1-like down day — has yet to surface.)
Returning to the S&P 500’s six-month view, the September downdraft has inflicted damage.
To reiterate, the mid-September trendline breakdown was fueled by aggressive 8-to-1 negative breadth. The subsequent rally attempt registered as comparably lackluster, stalling near trendline resistance.
More immediately, the downdraft from trendline resistance — a 2.0% single-day plunge — concluded with a narrow two-month closing low.
Combined, the late-September price action supports a bearish intermediate-term bias. Tactically, a reversal atop the 50-day moving average, currently 4,445, and the post-breakdown peak (4,463) would be cause to reconsider.
Recall that Thursday marks the third-quarter conclusion, and the session close may add color.
Watch List
Drilling down further, the 10-year Treasury note yield — most recently profiled Friday — has taken flight.
In the process, the yield has knifed to three-month highs, clearing a longer-term trendline hinged to the 2021 peak.
Tactically, the 1.50 area is followed by the breakout point (1.39) and the 200-day moving average, currently 1.38. A sustained posture higher signals a yield-bullish bias.
(The Sept. 8 review detailed the breakdown point (1.39) as a potentially consequential inflection point.)
Meanwhile, the United States Natural Gas Fund has staged an aggressive September rally. The fund tracks daily changes in the price of a short-term natural gas futures contract.
Technically, the prevailing upturn has been punctuated by three independent two standard deviation September breakouts, each encompassing consecutive closes atop the 20-day volatility bands. (Bands not illustrated.)
Though near-term extended, and due to consolidate, the massive one-month spike is longer-term bullish. Tactically, gap support (19.00) is followed by the 20-day moving average.
Charting market rotation — Pockets of strength surface
Moving U.S. sectors, pockets of strength have surfaced amid market rotation. Two groups exemplify the backdrop:
To start, the SPDR S&P Regional Banking ETF has come to life, clearing trendline resistance amid surging Treasury yields.
As always, regional banks benefit from rising yields in the form of an improved rate spread, or the difference between the interest rate at which a bank borrows, and the rate it subsequently lends to customers.
Technically, the upturn punctuates a double bottom defined by the July and September lows. The breakout point (67.00) pivots to support.
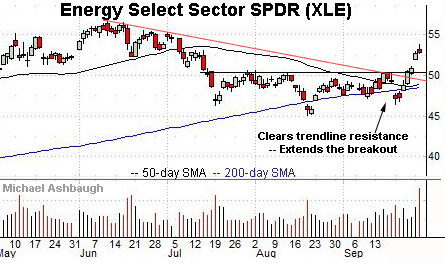
Meanwhile, the Energy Select Sector SPDR has extended a trendline breakout, initially detailed Friday. Recent follow-through punctuates a head-and-shoulders bottom defined by the July, August and September lows.
Tactically, gap support (51.95) is followed by the firmer breakout point (50.30).
Charting relative weakness amid market rotation
Conversely, the September volatility spike has also inflicted material sub-sector damage. Loosely speaking, the beneficiaries of the pandemic era have turned lower, pressured at least partly amid surging Treasury yields. Uncertainty elsewhere — including political uncertainty — may also be contributing to recent relative weakness.
To start, the Invesco QQQ Trust is a large-cap technology sector proxy.
As illustrated, the shares have pulled in from trendline resistance, pressured amid a volume spike.
The downturn places major support (359.96) — detailed Friday — firmly under siege.
Tuesday’s close (359.87) effectively matched support, and an extended retest remains underway.
As detailed previously, an eventual violation of this area (359.90) would mark a material “lower low” confirming the September trend shift.
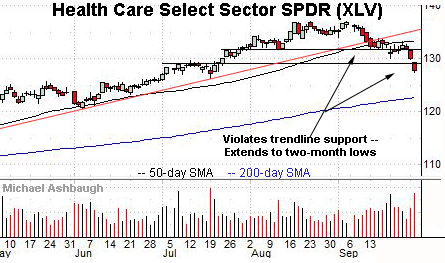
Meanwhile, the Health Care Select Sector SPDR has tagged two-month lows, extending a September trendline breakdown.
In the process, the group has confirmed its downtrend amid increased volume.
Tactically, near-term resistance (129.30) is followed by the breakdown point (131.70). A rally atop this area would place the brakes on bearish momentum.
Finally, the Consumer Staples Select Sector SPDR has registered three-month lows, pressured amid rising Treasury yields. (Yield = 2.4%.)
Fundamentally, the group’s dividend yield looks less attractive amid a rising interest rate environment, conventionally placing it under pressure.
Technically, recent weakness has been fueled by tandem volume spikes, placing the 200-day moving average, currently 68.92, firmly within view.
Summing up the sector backdrop
Collectively, the September price action remains rotational amid a change in sector leadership.
The question is whether the hand-off — the leadership change — can be relatively seamless as it applies to the major U.S. benchmarks.
For instance, the energy sector and financials combined account for about one half the weighting of the technology sector. So the prevailing leadership change presents a headwind — (to the extent leadership does indeed shift for the near-term) — and the backdrop is prone to potential incremental deterioration.


