Charting bullish follow-through, Dow industrials venture atop 200-day average
Focus: Small- and mid-cap benchmarks reclaim 200-day moving average amid broadening sector participation
Technically speaking, the major U.S. benchmarks continue to take flight, rising amid bullish August price action.
In the process, the S&P 500 has extended a bull-flag breakout — placing distance atop major resistance (4,170) — while the Dow Jones Industrial Average has reclaimed its marquee 200-day moving average. The charts below add color:
Editor’s Note: As always, updates can be directly accessed at https://chartingmarkets.substack.com.
Before detailing the U.S. markets’ wider view, the S&P 500’s hourly chart highlights the past four weeks.
As illustrated, the S&P has rallied sharply atop major resistance (4,170) an area also detailed on the daily chart.
Tactically, last week’s close (4,280) marks first support, and is followed by the firmer breakout point (4,170).
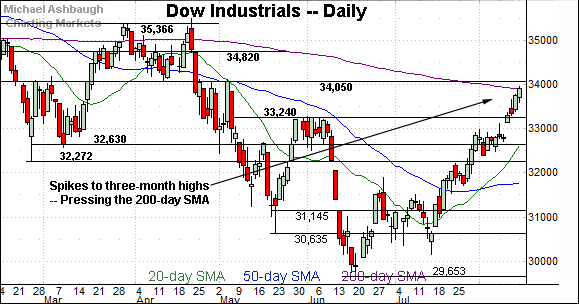
Meanwhile, the Dow Jones Industrial Average has staged a headline technical event.
Specifically, the index has edged atop its 200-day moving average, currently 33,888.
As always, the 200-day moving average is a widely-tracked longer-term trending indicator.
Slightly more broadly, the mid-August spike punctuates a bull-flag breakout, the steep rally from the previously tight early-August range. Constructive price action.
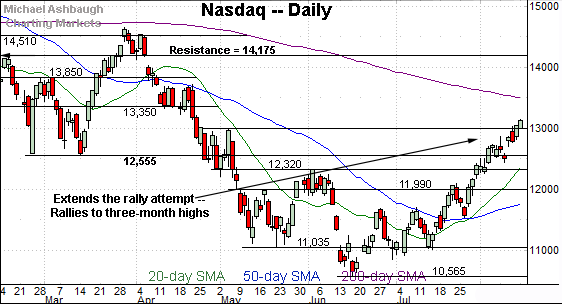
Against this backdrop, the Nasdaq Composite continues to trend higher.
The prevailing upturn builds on an aggressive late-July rally, better illustrated on the daily chart below.
Widening the view to six months adds perspective.
On this wider view, the Nasdaq has knifed to nearly four-month highs, its best level since April 22.
The prevailing upturn originates from a successful test of the 50-day moving average at the late-July low.
Tactically, the 13,000 mark is followed by a deeper floor in the 12,525-to-12,555 area. The prevailing rally attempt is intact barring a violation.
(On a granular note, recall the late-July spike marked an unusually bullish two standard deviation breakout — detailed previously — encompassing three closes atop the 20-day Bollinger bands (not illustrated) across a narrow five-session span.)
Looking elsewhere, the Dow Jones Industrial Average has knifed to a headline technical test.
Specifically, the index is challenging its 200-day moving average, currently 33,888. Tactically, sustained follow-through atop this area would signal a primary trend shift.
Slightly more broadly, the prevailing upturn punctuates a bull flag — the tight early-August range — hinged to the steep late-July rally.
Separately, the gap higher from the bull flag punctuates a runaway gap, building on the pre-existing uptrend. Bullish price action.
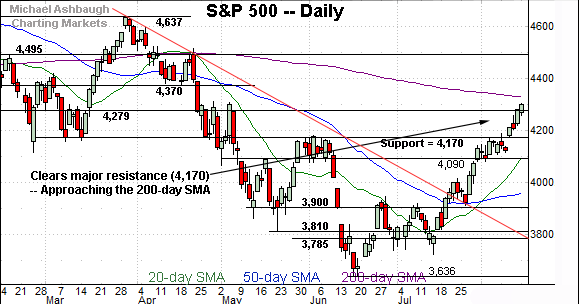
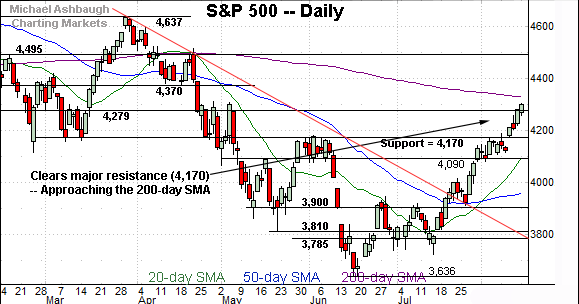
Meanwhile, the S&P 500 has extended a headline technical breakout.
Specifically, the index has placed distance atop major resistance (4,170) an important bull-bear fulcrum over the prior five months.
The prevailing upturn places the 200-day moving average, currently 4,326, firmly within striking distance.
Like the Nasdaq, the S&P 500’s steep rally originates from a successful test of the 50-day moving average at the late-July low.
(On a granular note, consider that last week’s close (4,280) matched familiar resistance (4,279) detailed repeatedly. This area remains an inflection point. Tuesday’s early session low (4,278) has registered nearby.)
The bigger picture
As detailed above, the major U.S. benchmarks continue to act well technically.
On a headline basis, the aggressive mid-August rally has once again confirmed each benchmark’s intermediate-term uptrend initially signaled last month.
See the July 21 review: Charting a (potential) bullish trend shift, S&P 500 stages trendline breakout.
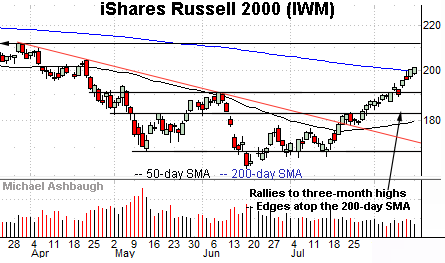
Moving to the small-caps, the iShares Russell 2000 ETF (IWM) has extended its August breakout.
In the process, the shares have notched consecutive closes atop the 200-day moving average, currently 199.54.
This marks the small-cap benchmark’s first close atop the longer-term trending indicator since Jan. 4, 2022. (Incidentally, this is the same date the S&P 500 registered its all-time high (4,818).)
Tactically, sustained follow-through atop the 200-day moving average would raise the flag to a primary trend shift. Conversely, the breakout point (190.90) pivots to notable support.
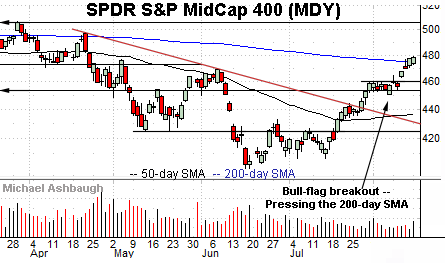
Meanwhile, the SPDR S&P MidCap 400 ETF (MDY) has extended its bull-flag breakout.
And here again, the mid-cap benchmark has registered consecutive closes atop its 200-day moving average, currently 474.58.
Tactically, the 200-day pivots to first support. Delving deeper, the June peak (469.15) is followed by the August breakout point (460.00).
Returning to the S&P 500, the chart above highlights likely consequential August price action.
To start, the index has placed distance atop major resistance (4,170) a familiar bull-bear fulcrum.
More broadly, the prevailing upturn originates from a successful test of trendline support closely matching the 50-day moving average.
Tactically, the breakout point (4,170) marks major support and is followed by the 4,090 floor. (The August closing low (4,091) matched support, and underpinned the flag pattern from which recent follow-through originates.)
The S&P 500’s backdrop supports a bullish intermediate-term bias barring a violation of the 4,090 area.
More immediately, the pending retest of the 200-day moving average, currently 4,326, should be a useful bull-bear gauge. Recall the small- and mid-cap benchmarks — as well as the Dow Jones Industrial Average — have already edged atop the 200-day moving average.
Beyond specific levels, the prevailing rally attempt has been punctuated by statistically unusual price action (two standard deviation breakouts), firmly-bullish internals (10-to-1 up days) and still broadening sector participation, detailed last week.
No new setups today. Back in action Thursday.


