Bull trend confirmed, Dow industrials within striking distance of 40,000 mark
Focus: Major U.S. benchmarks tag record highs as Q1 close approaches
Technically speaking, the major U.S. benchmarks continue to trend higher, rising as the first-quarter conclusion (end of March) approaches.
On a headline basis, the S&P 500 and Dow industrials have concurrently tagged all-time highs, knifing from previously tight March ranges. Meanwhile, the Nasdaq Composite has registered a record closing high, amid a breakout attempt that technically remains underway. The charts below add color:
Editor’s Note: As always, updates can be directly accessed at https://chartingmarkets.substack.com.
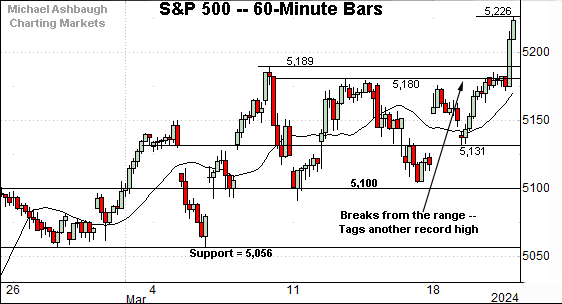
Before detailing the U.S. markets’ wider view, the S&P 500’s hourly chart highlights the past four weeks.
As illustrated, the S&P 500 has knifed to its latest all-time high.
The breakout puntuates a tight mid-March range, spanning about 90 points, or less than 2.0%. Tactically, the breakout point — the 5,180 area — pivots to support.
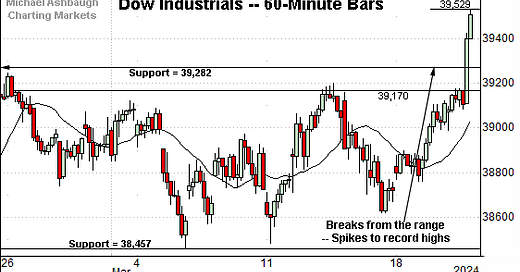
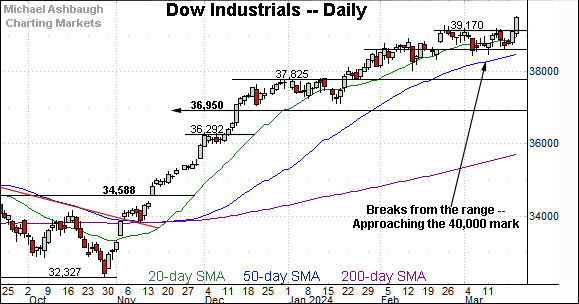
Similarly, the Dow Jones Industrial Average has knifed to record territory.
The prevailing upturn punctuates a one-month range, also illustrated on the daily chart. Tactically, the 39,280 and and 39,170 areas pivot to support.
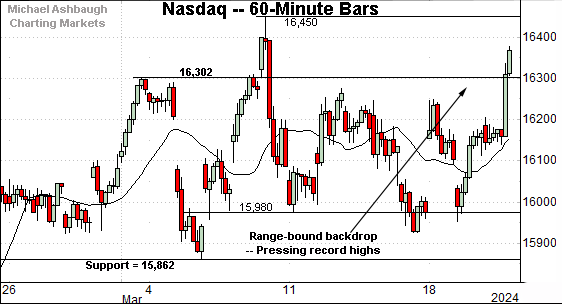
Against this backdrop, the Nasdaq Composite has also staged a breakout of sorts.
Here again, the prevailing upturn punctuates a relatively tight mid-March range. Tactically, the 16,300 area marks an inflection point.
Combined, each big three benchmark has staged a late-March spike, rising amid well received Federal Reserve policy language.
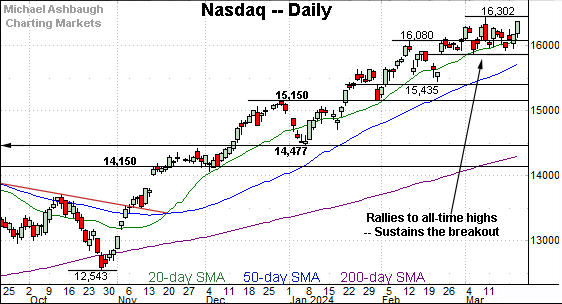
Widening the view to six months adds perspective.
On this wider view, the Nasdaq has registered an all-time closing high.
Slightly more broadly, the prevailing four-week range is a bullish continuation pattern, hinged to the sharp late-February gap higher. Tactically, the 15,860 area marks notable support. (Also see the hourly chart.)
Looking elsewhere, the Dow Jones Industrial Average has broken more decisively to all-time highs.
The prevailing upturn punctuates a tight four-week range — a coiled spring — likely confirming the primary uptrend. (The single-day spike registered as a nearly 1.0% breakout.)
More broadly, the marquee 40,000 mark is firmly within striking distance.
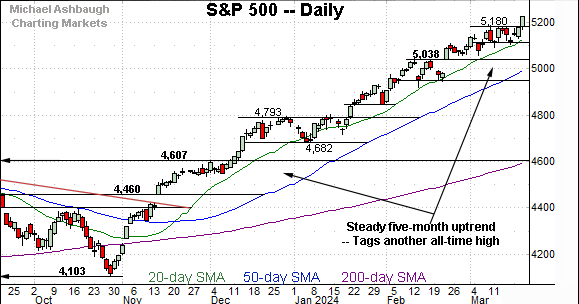
Meanwhile, the S&P 500 has also tagged its latest record high.
Recent follow-through punctuates an unusually steady five-month uptrend. The prevailing trend has tracked atop the 20-day moving average (in green) a widely-tracked near-term trending indicator.
The bigger picture
As detailed above, the prevailing bigger-picture uptrend is largely on auto-pilot. At least for now.
On a headline basis, each big three benchmark has concurrently registered an all-time closing high. Bullish momentum is intact as the first-quarter conclusion approaches. (The end of March.)
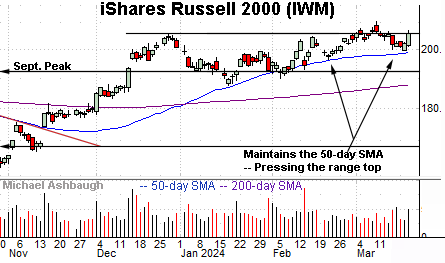
Moving to the small-caps, the iShares Russell 2000 ETF (IWM) continues to lag behind.
Nonetheless, the small-cap benchmark continues to hold its range top after briefly tagging 23-month highs.
Tactically, the 50-day moving average has marked an inflection point going back before November trendline breakout.
Meanwhile, the SPDR S&P MidCap 400 ETF (MDY) continues to outpace the small-caps.
As illustrated, the MDY has asserted a tight March range, digesting an early-month rally to all-time highs.
The prevailing flag-like pattern — the tight range — lays the groundwork for potential upside follow-through.
Returning to the S&P 500, the index continues to grind higher.
The mid-January breakout placed the S&P at all-time highs — atop the 2022 peak (4,818) — and the index has since trended steadily higher.
The early-year uptrend tracks atop the 20-day moving average (in green) a widely-tracked near-term trending indicator.
Tactically, the breakout point (5,180) is followed by the March range bottom, circa 5,050.
Delving deeper, the 50-day moving average, currently 5,000, is rising toward gap support (5,038).
As always, it’s not just what the markets do, it’s how they do it. But broadly speaking, the S&P 500’s bigger-picture bias remains bullish barring a violation of the 5,000-to-5,040 area.
Also see Feb. 22: Bull trend intact, S&P 500 absorbs mid-month downdraft.

