Charting a bearish double top, S&P 500 violates major support (3,900)
Focus: Transports and financials violate major support, Silver sustains technical breakout
Broadly speaking, the major U.S. benchmarks have staged a technically damaging late-year downturn.
The prevailing pullback punctuates a double top — defined by the December peaks — signaling the late-year rally attempt has likely run its course.
Editor’s Note: As always, updates can be directly accessed at https://chartingmarkets.substack.com.
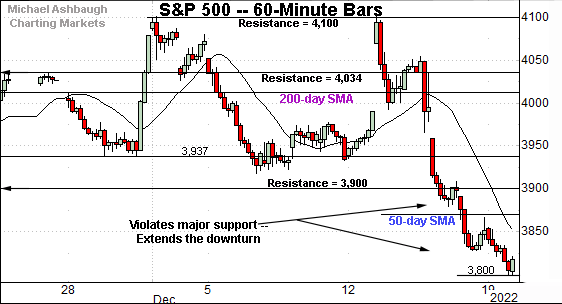
Before detailing the U.S. markets’ wider view, the S&P 500’s hourly chart highlights the past four weeks.
As illustrated, the S&P has tagged one-month lows.
The prevailing downturn punctuates a double top — the M formation — defined by the December peaks (4,100). (The 4,100 mark has capped two aggressive single-day spikes.)
From current levels, the breakdown point (3,900) pivots to resistance.
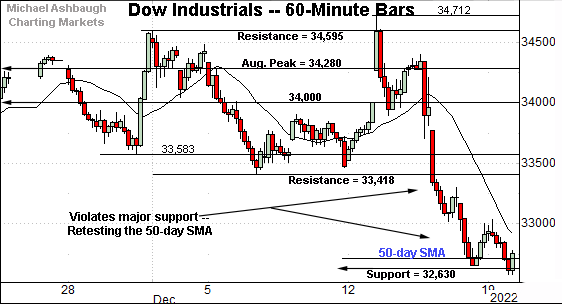
Similarly, the Dow Jones Industrial Average has tagged one-month lows.
Here again, the downturn punctuates a double top defined by the early-December peak (34,595).
Tactically, the 33,420 area pivots to notable resistance.
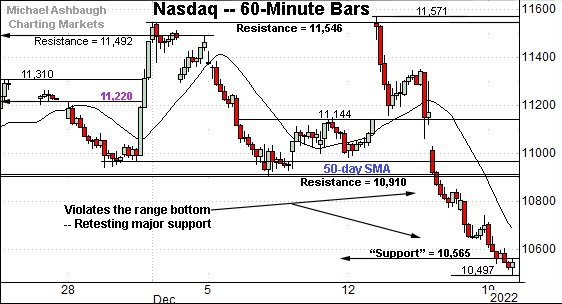
Against this backdrop, the Nasdaq Composite has also turned lower, selling off from its range top.
Tactically, the breakdown point (10,910) closely matches the 50-day moving average, currently 10,926. This area marks well-defined resistance.
Conversely, the index is challenging major support (10,565) an area better illustrated on the daily chart below.
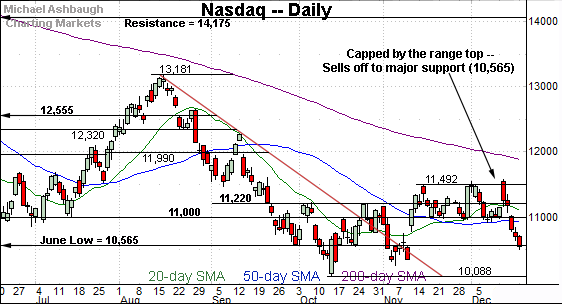
Widening the view to six months adds perspective.
On this wider view, the Nasdaq has violated its one-month range bottom. The downturn likely wrecks its late-year rally attempt.
Tactically, the 50-day moving average closely matches the breakdown point, levels detailed on the hourly chart. The Nasdaq’s backdrop signals a bearish bigger-picture bias pending a close atop this area. (See the Dec. 14 review.)
More immediately, the index is challenging major support — the 10,565-to-10,572 area — levels matching the June low (10,565) and September low (10,572) respectively.
Looking elsewhere, the Dow Jones Industrial Average remains the strongest benchmark.
Still, the index has extended a relatively aggressive downturn from its range top. Tactically, the 50-day moving average, currently 32,725, is followed by major support (32,630). (Also see the hourly chart.)
Delving slightly deeper, the 200-day moving average, currently 32,450, marks a headline inflection point.
Tactically, follow-through under this area — the 50- and 200-day moving averages — would strengthen the bear case.
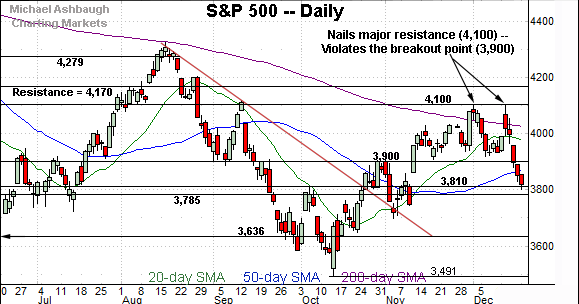
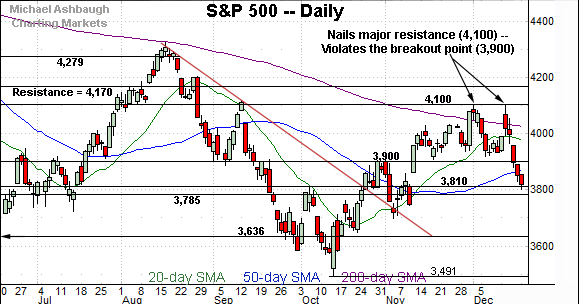
Meanwhile, the S&P 500 has extended a downdraft from major resistance (4,100).
The prevailing pullback places it back under the breakout point (3,900) — and the 50-day moving average, currently 3,871 — signaling a bearish intermediate-term bias. (In this case, also a bearish longer-term bias.)
The bigger picture
As detailed above, the major U.S. benchmarks have extended a December downdraft, selling off persistently from major resistance.
The prevailing pullback punctuates a double top — defined by the December peaks — and signals the late-year rally attempt has likely run its course.
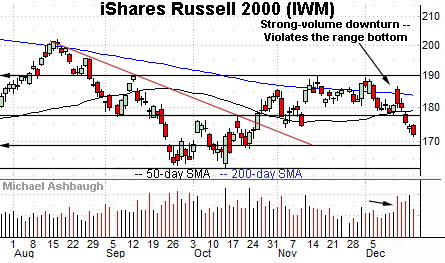
Moving to the small-caps, the iShares Russell 2000 ETF (IWM) has turned lower.
The prevailing downturn has been fueled by increased volume to punctuate a failed test of the range top at the December and November peaks.
Tactically, the breakdown point (178.00) is closely followed by the 50-day moving average, currently 179.15. The initial retest from underneath would be expected to draw selling pressure.
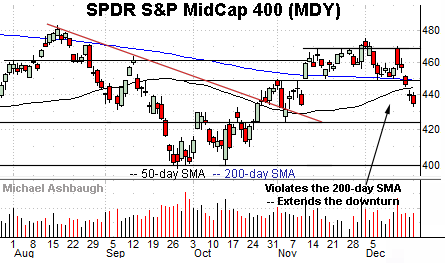
Meanwhile, the SPDR S&P MidCap 400 ETF (MDY) has extended a downturn from four-month highs.
In the process, the MDY has violated its 50- and 200-day moving averages.
Tactically, the breakdown point (449.50) pivots to well-defined resistance. A sustained posture lower signals a bearish bias.
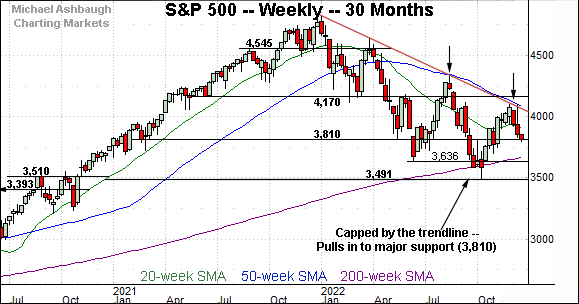
Returning to the S&P 500, this next chart is a weekly view spanning 30 months. Each bar on the chart represents one week.
As illustrated, the S&P 500 has once again balked at trendline resistance, a level closely tracking the 50-week moving average.
Recall the trendline is hinged to the S&P’s all-time high, established nearly one year ago, on Jan. 4, 2022.
More immediately, the prevailing downturn places major support under siege — the 3,785-to-3,810 area. Delving deeper, the 200-week moving average, currently 3,663, is closely followed by the June low (3,636).
Returning to the S&P 500’s six-month view adds perspective.
As illustrated, the S&P has violated its breakout point (3,900) a key bull-bear fulcrum detailed repeatedly. The decisive violation — a 2%+ breakdown — signals a bearish bigger-picture bias.
Delving deeper, the 3,785-to-3,810 area marks major support. (See the second-quarter close (3,785), the May low (3,810) and the September Fed-induced inflection point (3,790).)
The quality of the rally attempt from this area may add color.
More broadly, the prevailing downturn punctuates a second December test of the 200-day moving average, and a trendline test on the weekly chart.
Similarly, the August peak marked a failed test of the 200-day moving average, as well as a trendline test on the weekly chart.
So collectively, the prevailing downturn originates from major resistance — on the hourly, daily and weekly charts — inflicting technical damage.
The downdraft places the S&P 500 back under its breakout point (3,900) — and the 50-day moving average — signaling a bearish bias pending repairs. A swift reversal back atop the 3,900 area would be cause to reassess.
Editor’s Note: This is the last 2022 review. The next review will be published next month. Happy Holidays!
Watch List
Drilling down further, the Financial Select Sector SPDR (XLF) has turned lower.
In the process, the group has violated its 50- and 200-day moving averages — across consecutive sessions — likely wrecking its late-year rally attempt.
Tactically, the breakdown point (34.40) pivots to resistance. A sustained posture lower signals a bearish intermediate-term bias.
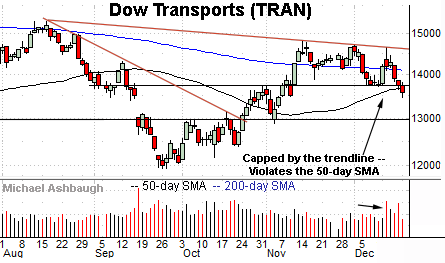
Similarly, the Dow Transports (TRAN) have tagged one-month lows. The prevailing strong-volume downturn originates from trendline resistance.
Tactically, the 50-day moving average, currently 13,712, closely matches the breakdown point (13,718). A reversal atop this area would place the group on firmer technical ground.
Combined, the transports and financials are traditional sector leaders. The tandem late-year downturns strengthen the broad-market bear case.
Finally, the iShares Silver Trust (SLV) is acting well technically.
Late last month, the shares knifed atop the 200-day moving average, tagging seven-month highs on increased volume.
By comparison, the prevailing pullback has been flat, fueled by decreased volume.
Tactically, the breakout point (20.25) marks a well-defined floor. The prevailing rally attempt is intact barring a violation.


