Charting a bull-bear stalemate, S&P 500 asserts range hinged to key level (4,460)
Focus: Small- and mid-cap benchmarks pull in amid bearish summer price action
Technically speaking, the major U.S. benchmarks have weathered a thus far modest September downturn.
Against this backdrop, the S&P 500 and Nasdaq Composite are holding tightly to familiar inflection points, levels roughly matching their 50-day moving averages. Tactically, the S&P 4,460 and Nasdaq 13,860 areas remain in play.
Editor’s Note: As always, updates can be directly accessed at https://chartingmarkets.substack.com.
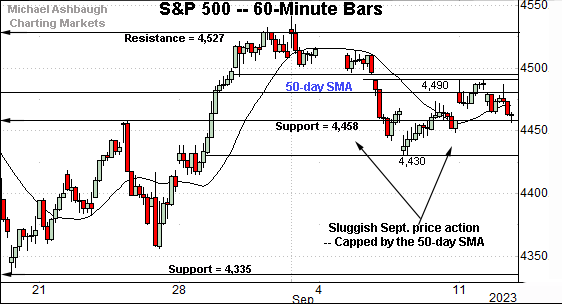
Before detailing the U.S. markets’ wider view, the S&P 500’s hourly chart highlights the past four weeks.
As illustrated, the S&P 500 has pulled in from its range top. The prevailing downturn places it back under the 50-day moving average, currently 4,480.
Separately, the 4,460 area remains an inflection point, also detailed on the daily chart. (The immediate range spans 30 points from 4,460 in each direction.)
So broadly speaking, the 4,460-to-4,480 area marks a bull-bear fulcrum, territory the S&P has favored of late. (See the Aug. 29 review.)
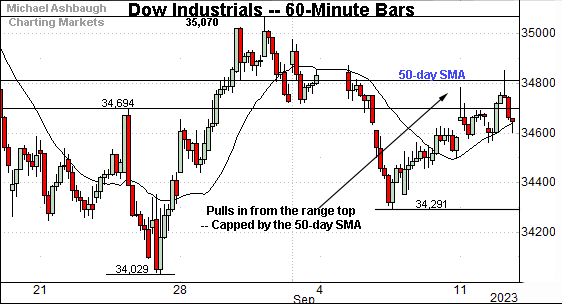
Similarly, the Dow Jones Industrial Average has staged a modest September pullback.
Here again, the subsequent rally attempt has been capped by the 50-day moving average, currently 34,808.
As always, the 50-day moving average is a widely-tracked intermediate-term trending indicator.
Against this backdrop, the Nasdaq Composite has also pulled in from its range top.
True to form elsewhere, its recent rally attempt has been lackluster, and capped by the 50-day moving average, currently 13,878.
Separately, recall the 13,860 area marks an inflection point, a level also detailed on the daily chart below. (See the Aug. 29 review.)
So combined, the 13,860-to-13,880 area marks a bull-bear fulcrum.
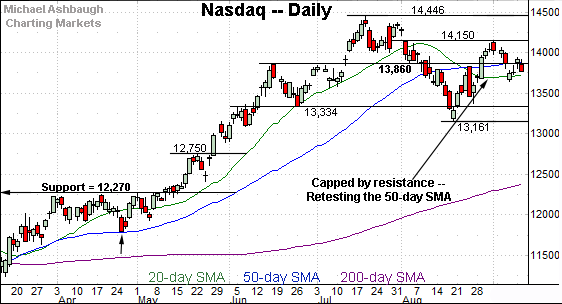
Widening the view to six months adds perspective.
On this wider view, the Nasdaq has registered jagged summer price action.
Against this backdrop, market bears will point to a developing head-and-shoulders top defined by the June, July and September peaks.
Tactically, the 13,860-to-13,880 area remains a useful inflection point, levels also detailed on the hourly chart. The mid-September price action has thus far marked a bull-bear stalemate.
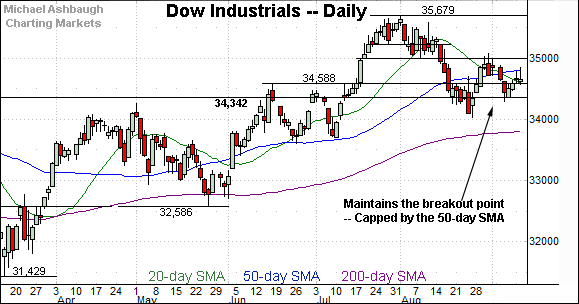
Looking elsewhere, the Dow Jones Industrial Average has asserted a tight three-week range.
Within the range, the Dow has not strayed too far from its 50-day moving average, currently 34,808, a familiar bull-bear inflection point. Recall the 50-day punctuated the June and July lows.
So here again, the late-summer price action marks a bull-bear stalemate.
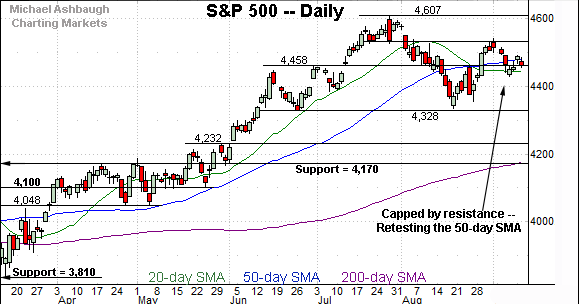
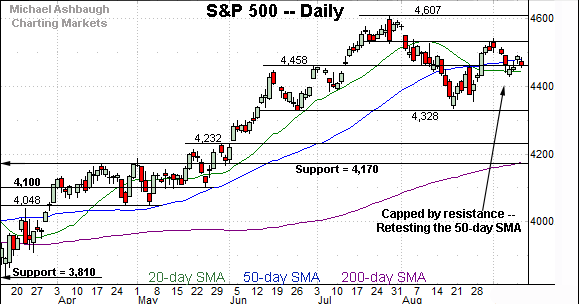
Meanwhile, the S&P 500 is also hugging familiar technical territory.
The specific area matches the former breakout point (4,458) and the 50-day moving average, currently 4,480.
The August breaks from this area have been punctuated the September pullback, and a tight one-week range.
The bigger picture
As detailed above, the major U.S. benchmarks have pulled in to increasingly familiar technical territory.
On a headline basis, the S&P 4,460 and Nasdaq 13,860 areas remain inflection points, levels roughly matching each benchmark’s 50-day moving average. The mid-September price action has marked a stalemate, effectively hinged to each area.
Moving to the small-caps, the iShares Russell 2000 ETF (IWM) has reached an important technical test.
Specifically, the small-cap benchmark is back for its second recent test of the 200-day moving average, currently 183.08. As always, the 200-day is a widely-tracked longer-term trending indicator.
More broadly, notice the developing head-and-shoulders top defined by the June, July and September peaks. The 200-day moving average roughly tracks the pattern’s neckline.
Tactically, an eventual violation of the 200-day moving average would punctuate the head-and-shoulders top, opening the path to potentially aggressive downside follow-through.
On a more granular note, the early-September downturn has been fueled by increased volume, and punctuated by a flattish lighter-volume rally attempt. Shaky price action.
Similarly, the SPDR S&P MidCap 400 ETF (MDY) has registered a strong-volume early-September downturn and subsequently sluggish rally attempt. (If we can even call the recent price action a rally attempt.)
And here again, notice the developing head-and-shoulders top.
Tactically, a violation of the pattern’s neckline (in green) and the slightly deeper 200-day moving average, currently 465.40, would raise a technical red flag.
Returning to the S&P 500, the index is traversing increasingly familiar technical territory.
The specific area matches the former breakout point (4,458) and the 50-day moving average, currently 4,480.
So tactically, the 4,460-to-4,480 area marks an intermediate-term bull-bear fulcrum. The August breaks from this area — in each direction — failed to materially follow-through.
On further strength, follow-through atop the S&P 4,530 area would strengthen the bull case. (See the hourly chart.)
Conversely, the 4,328-to-4,335 area marks important support. An eventual violation would mark a material “lower low” raising a caution flag.
As always, it’s not just what the markets do, it’s how they do it. Beyond near-term issues, the U.S. benchmarks’ broader technical trends remain bullish. (The Nasdaq 13,860-to-13,880 area is also worth tracking, in tandem with S&P 4,460.)
Also see Aug 29: Charting a bull-bear battle, S&P 500 challenges the breakdown point (4,460).


