Charting a major bull-bear clash, S&P 500 challenges the 200-day average
Focus: Rate-sensitive sectors turn higher, Europe's technical breakout, Caterpillar tags all-time highs, IEV, IYR, XHB, CAT
Technically speaking, the major U.S. benchmarks continue to trend higher, extending a rally attempt after well received inflation data.
In the process, the S&P 500 is challenging its 200-day moving average, a widely-tracked longer-term trending indicator defining the current bull-bear battleground.
Editor’s Note: As always, updates can be directly accessed at https://chartingmarkets.substack.com.
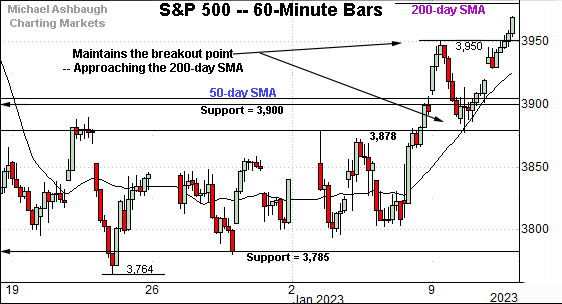
Before detailing the U.S. markets’ wider view, the S&P 500’s hourly chart highlights the past four weeks.
As illustrated, the S&P is off to a bullish January start, rising from a successful test of the breakout point (3,878).
The prevailing upturn places the 200-day moving average, currently 3,984, firmly within striking distance.
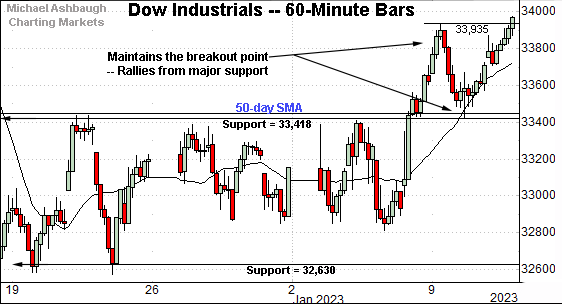
Meanwhile, the Dow Jones Industrial Average is also acting well technically.
Here again, the index has maintained its breakout point (33,418) and subsequently extended its rally attempt.
The week-to-date low (33,421) has closely matched the inflection point detailed previously. (See for instance, the Jan. 4 review.)
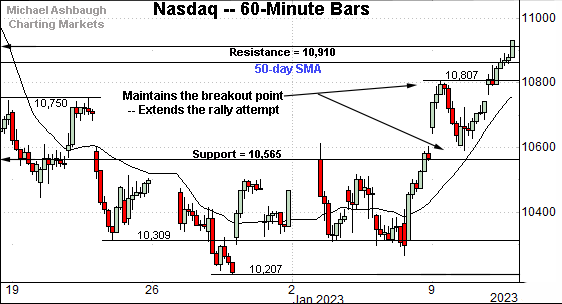
Against this backdrop, the Nasdaq Composite has also broken out.
This week’s follow-through places it back atop the 50-day moving average, currently 10,860, for the first time since mid-December.
Slightly more broadly, the index has sustained a break atop major support (10,565), an area also illustrated below.
Widening the view to six months adds perspective.
On this wider view, the Nasdaq has extended its January rally attempt.
The prevailing upturn places it back atop the 50-day moving average, currently 10,860, as well as the December breakdown point (10,910).
Tactically, a sustained posture atop this area (10,910) signals a bullish-leaning intermediate-term bias. (See the aggressive November break higher, and December downdraft lower.)
Looking elsewhere, the Dow Jones Industrial Average remains the strongest major benchmark.
The prevailing upturn places it back atop the 50-day moving average, currently 33,464, and within striking distance of the range top.
Tactically, notable resistance matches the August peak (34,281). The pending retest from underneath should be a useful bull-bear gauge.
More broadly, recall the developing cup-and-handle defined by the October and December lows (as well as the August and November peaks).
Similarly, the S&P 500 has extended its January breakout.
To reiterate, the upturn places the 200-day moving average, currently 3,984, firmly within view.
Conversely, the 50-day moving average, currently 3,911, is closely followed by support matching the 3,900 mark.
The bigger picture
As detailed above, the major U.S. benchmarks are vying to extend a January rally attempt.
Against this backdrop, each big three U.S. benchmark has reclaimed its 50-day moving average in recent sessions — (over the prior one to four sessions) — raising the flag to a bullish-leaning intermediate-term technical tilt.
To be sure, the prevailing rally is far from textbook bullish — as measured by volume, breadth and sector participation — though the price action itself is nonetheless constructive for now.
Moving to the small-caps, the iShares Russell 2000 ETF (IWM) has also extended its rally attempt.
In the process, the small-cap benchmark has edged atop its 50- and 200-day moving average across consecutive sessions.
On further strength, additional resistance, circa 186, is followed by the three-month range top (189.90). (Recall the Russell 2000 has struggled to place material distance atop the 200-day moving average since November 2021.)
Meanwhile, the SPDR S&P MidCap 400 ETF (MDY) continues to outpace the Russell 2000.
As illustrated, the MDY has placed distance atop its 50- and 200-day moving averages, rising toward the range top (468.80).
But notably, the prevailing upside follow-through has registered amid conspicuously lackluster volume. (Also see the Russell 2000’s lukewarm volume even as it reclaims the 200-day moving average. Material trend shifts rarely register without volume.)
Returning to the S&P 500, this next chart is a weekly view spanning 30 months. Each bar on the chart represents one week.
As illustrated, the S&P 500 is approaching a truly significant technical test.
Specifically, the index is rising toward trendline resistance, a level hinged to the S&P’s all-time high, established one year ago, on Jan. 4, 2022.
Against this backdrop, the prior trendline test — last month — marked the first trendline test that has not been followed by downside follow-through to a “lower low.”
In fact, the prevailing upturn originates from major support — also illustrated below — in the 3,785-to-3,810 area.
So combined, the prevailing backdrop presents a bull-bear clash between trendline resistance and major support (3,810). The pending break in either direction (potentially over the next few weeks) may be consequential.
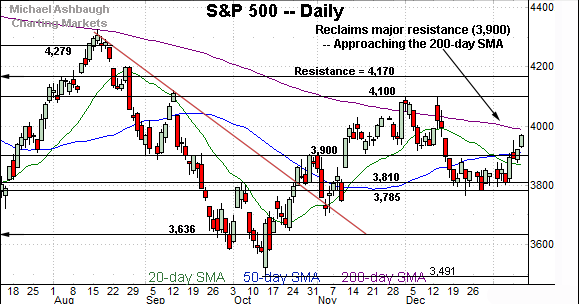
Returning to the six-month view, the S&P 500 is approaching an equally significant test on the daily chart.
Specifically, the S&P is poised to challenge its 200-day moving average, currently 3,984. (The S&P has not registered more than three consecutive closes atop the 200-day since March.)
So collectively, the prevailing upturn places the 200-day moving average — and trendline resistance on the weekly chart — firmly within striking distance.
Sustained follow-through atop this area — the 3,984-to-4,000 area — would raise the flag to a potential longer-term trend shift. On further strength, major resistance matches the 4,100 mark.
Conversely, the 3,900 mark — an area roughly matching the 50-day moving average — pivots to notable support. The prevailing rally attempt is intact barring a violation.
As always, it’s not just what the benchmarks do, it’s how they do it. (The “how they do it” has been lacking amid the current rally.) The next several sessions will likely add color.
Editor’s Note: The next review will be published Wednesday, Jan. 18.
Watch List
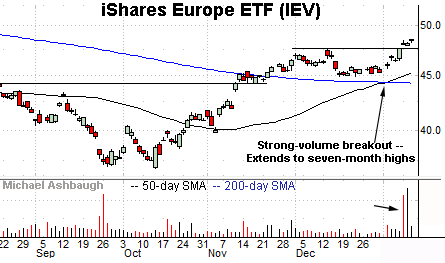
Drilling down further, the iShares Europe ETF (IEV) has broken out.
Specifically, the shares have knifed to seven-month highs, clearing the December peak amid a volume spike.
Tactically, the breakout point (47.65) pivots to support. A sustained posture higher signals a comfortably bullish bias.
Slightly more broadly, notice the golden cross — or bullish 50-day/200-day moving average crossover — to start the new year. The intermediate-term uptrend has overtaken the longer-term trend. (Also see the Nov. 17 review and Dec. 1 review.)
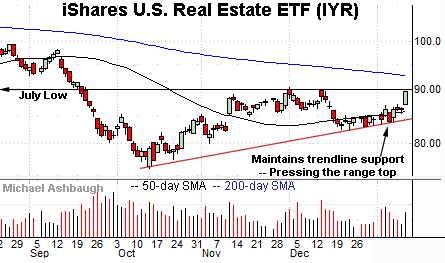
Moving to U.S. sectors, the iShares U.S. Real Estate ETF (IYR) is challenging its range top. (Yield = 3.1%.)
The prevailing upturn originates from trendline support, and has been fueled by a volume uptick.
Tactically, a breakout likely opens the path to the 200-day moving average, currently 92.75, a level that has capped the group since April.
Conversely, the 50-day moving average, currently 85.88, has marked an inflection point and is closely followed by trendline support. The group’s breakout attempt is intact barring a violation.
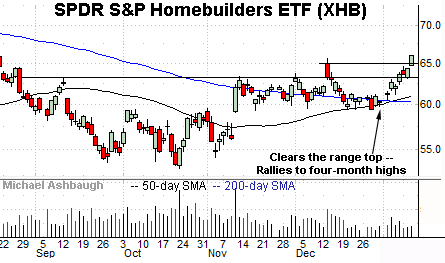
Meanwhile, the SPDR S&P Homebuilders ETF (XHB) is another interest rate-sensitive sector coming to life.
As illustrated, the group has tagged four-month highs, placing distance atop resistance matching the September and November peaks.
To be sure, the prevailing upturn has been fueled by lackluster volume, raising a question as to sustainability and potential follow-through.
Nonetheless, the price action is constructive. Tactically, the breakout point (65.00) is followed by the former range top (63.40). Also notice the recent golden cross — or bullish 50-day/200-day moving average crossover — to start January.
Finally, Dow 30 component Caterpillar, Inc. (CAT) has staged a stealth 2023 breakout. (Yield = 2.0%.)
In the process, the shares have tagged all-time highs, rising from a tight six-week range. The prevailing upturn builds on the October earnings-fueled spike atop the 200-day moving average.
From current levels, the 50-day moving average is rising toward the breakout point (243.00). A sustained posture higher signals a firmly-bullish bias.


