Charting an orderly pullback, S&P 500 retests the breakout point (3,900)
Focus: Pockets of sector strength emerge, Energy sector challenges eight-year highs, Europe presses 200-day average, XLE, XLF, XLV, IEV
Technically speaking, the November rally attempt is intact, though amid a backdrop that is not one-size-fits-all.
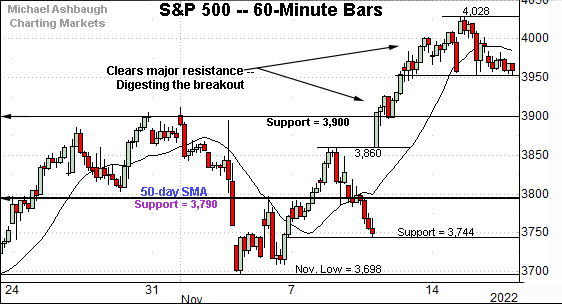
Amid the cross currents, the S&P 500 has thus far sustained its November breakout, maintaining a posture atop its first significant support (3,900).
Editor’s Note: As always, updates can be directly accessed at https://chartingmarkets.substack.com.
Before detailing the U.S. markets’ wider view, the S&P 500’s hourly chart highlights the past four weeks.
As illustrated, the S&P is digesting a November breakout.
From current levels, the breakout point (3,900) marks major support, and is followed by the top of last week’s gap (3,860).
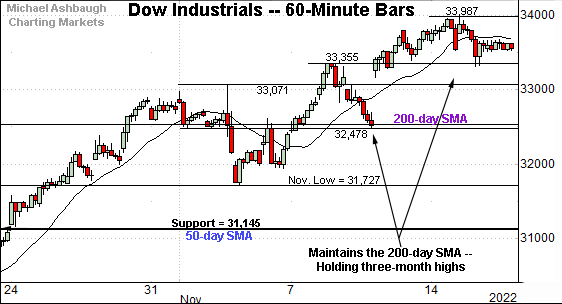
Similarly, the Dow Jones Industrial Average has thus far sustained its recent breakout.
Recall recent follow-through punctuates a successful test of the 200-day moving average, currently 32,507.
Delving deeper, the November low (31,727) marks an inflection point.
Against this backdrop, the Nasdaq Composite continues to lag behind.
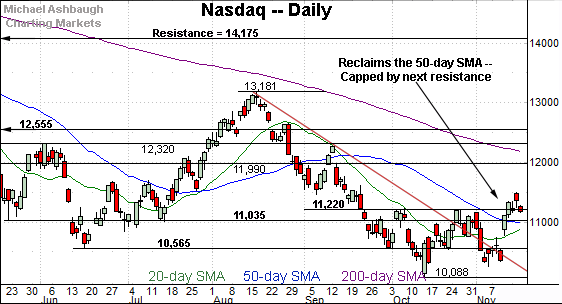
In fact, the index has whipsawed at its range top (11,220), thus far struggling to sustain a breakout. Resistance is also detailed on the daily chart below.
Widening the view to six months adds perspective.
On this wider view, the Nasdaq has whipsawed at its two-month range top (11,220). Recall the 11,220 area, established after the Federal Reserve’s September policy statement.
Delving slightly deeper, the Nasdaq has sustained a break atop the 50-day moving average, currently 10,975. Tactically, the Nasdaq’s recovery attempt is intact barring a violation of the 10,975-to-11,035 area.
Looking elsewhere, the Dow Jones Industrial Average continues to outperform.
As illustrated, the index has sustained a break atop the 200-day moving average, rising within striking distance of six-month highs. (The October spike marked a two standard deviation breakout, and has been punctuated by upside follow-through.)
On further strength, next resistance (34,050) is closely followed by the August closing peak (34,152) and the absolute August peak (34,281).
More broadly, the nearly straightline rally from the October low — and comparably flattish pullbacks — are technically constructive.
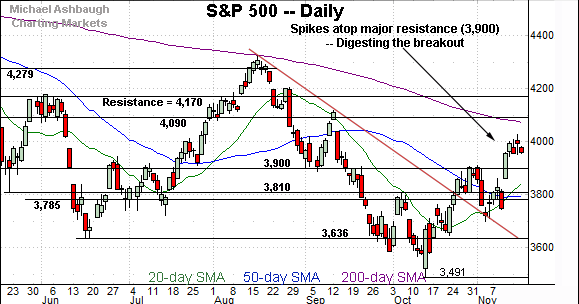
Meanwhile, the S&P 500 has sustained a break to two-month highs.
Tactically, the breakout point (3,900) pivots to major support. Delving deeper, the November rally originates from trendline support.
The bigger picture
As detailed above, the November rally attempt is intact, though amid a backdrop that is not one-size-fits-all. The major benchmarks remain in divergence mode.
On a headline basis, the Dow industrials continue to outperform — sustaining a break atop the 200-day moving average — while the Nasdaq Composite is struggling to reach two-month highs.
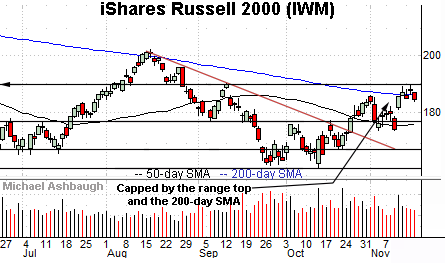
Moving to the small-caps, the iShares Russell 2000 ETF (IWM) continues to press major resistance.
The specific area matches the 200-day moving average, currently 185.95, and the former range top (189.90).
Note the 200-day has effectively capped the small-cap benchmark since November 2021.
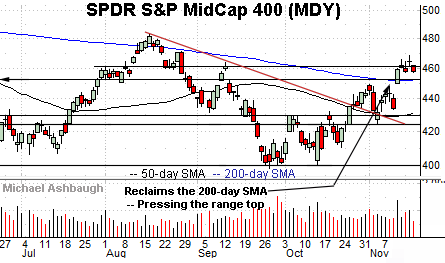
Meanwhile, the SPDR S&P MidCap 400 ETF (MDY) remains slightly stronger than the Russell 2000.
As illustrated, the mid-cap benchmark has sustained a modest break atop the 200-day moving average, rising to challenge the September peak.
Tactically, the 200-day moving average, currently 451.44, is closely followed by gap support (449.80). A violation of this area would raise a caution flag.
Returning to the S&P 500, the index has sustained its November breakout, rising sharply from trendline support.
From current levels, the breakout point (3,900) marks a significant floor.
Delving deeper, the 50-day moving average, currently 3,792, matches major support in the 3,785-to-3,810 area. (See the second-quarter close (3,785), the September Fed-induced level (3,790), the 50-day moving average, currently 3,792, and the May low (3,810).)
Against this backdrop, the recovery attempt gets the benefit of the doubt barring a violation of the 3,800 area. More broadly, the S&P 500’s bigger-picture backdrop remains bearish pending more extensive repairs.
Watch List — Pockets of sector strength surface
Drilling down further, pockets of sector strength have emerged (or persisted, as the case may be) amid the late-year rally. The groups detailed would be expected to outperform to the extent the broad-market recovery atttempt is sustained:
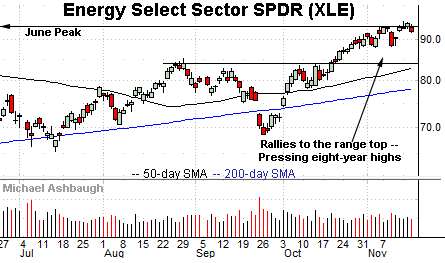
To start, the Energy Select Sector SPDR (XLE) remains the strongest U.S. sector, rising to challenge eight-year highs.
Tactically, the November low (87.90) is followed by the October breakout point (83.70). A sustained posture atop this area signals a bullish bias. (Also see the Oct. 20 review, amid the group’s breakout attempt.)
Meanwhile, the Financial Select Sector SPDR’s (XLF) backdrop continues to strengthen.
Technically, the shares have reclaimed the 200-day moving average — amid a volume spike — rising to challenge six-month highs. Selling pressure near the range top has been flat, laying the groundwork for potential follow-through.
Tactically, gap support (34.80) is closely followed by the 200-day moving average, currently 34.64. The group’s breakout attempt is intact barring a violation.
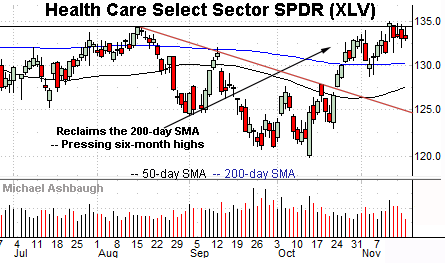
Similarly, the Health Care Select Sector SPDR (XLV) has come to life technically.
The group initially spiked three weeks ago, clearing trendline resistance and the 200-day moving average. More immediately, the sideways November chop lays the groundwork for potential follow-through.
One concern, illustrated above, is that the late-October spike registered amid decreased volume, while selling pressure has picked up near the range top.
Nonetheless, the 200-day moving average, currently 130.16, offers an area to work against. A breakout attempt is in play barring a violation.
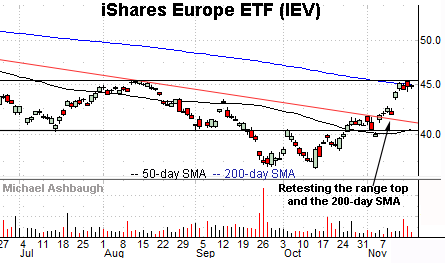
Beyond the U.S., the iShares Europe ETF (IEV) has reached a major techical test.
Specifically, the shares are challenging a five-month range top (45.50) and the 200-day moving average, currently 44.98. The prevailing tight four-session range punctuates a decisive November trendline breakout.
Tactically, the prevailing rally attempt is intact barring a violation of gap support (43.40).
Also see Nov. 15: S&P 500 extends bear-market rally as market rotation persists.


