Charting a corrective bounce, S&P 500 rallies from major support (3,785)
Focus: Small- and mid-caps assert lower plateau, Nasdaq capped by major resistance (10,565)
Technically speaking, the major U.S. benchmarks are vying to start the new year with an upturn, rising in the wake of a less-than-stellar 2022 performance.
The prevailing rally attempt places major resistance within view — the S&P 3,900 area, matching the 50-day moving average — and the pending retest from underneath should be a useful bull-bear gauge.
Editor’s Note: As always, updates can be directly accessed at https://chartingmarkets.substack.com.
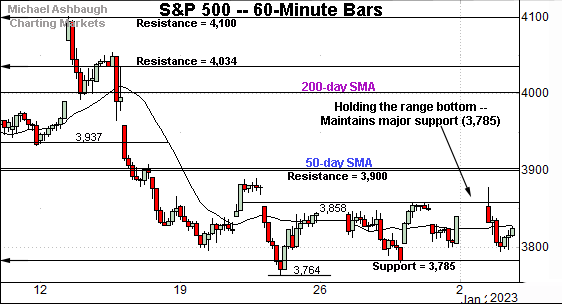
Before detailing the U.S. markets’ wider view, the S&P 500’s hourly chart highlights the past four weeks.
As illustrated, the S&P is holding its range bottom.
Tactically, the prevailing range has been underpinned by major support (3,785) detailed previously.
Conversely, near-term resistance (3,858) is followed by major overhead (3,900) matching the 50-day moving average, currently 3,903.
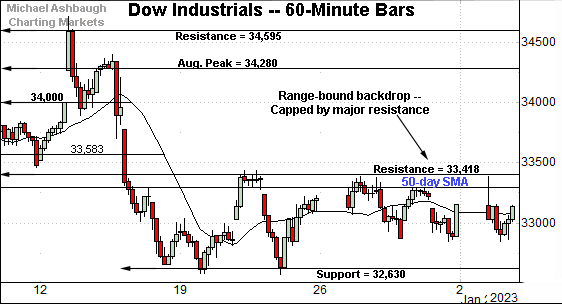
Similarly, the Dow Jones Industrial Average is broadly holding its one-month range bottom.
Tactically, the 50-day moving average, currently 33,284, is followed by major resistance (33,418) detailed previously.
Conversely, the prevailing range has been underpinned by major support (32,630) an area also detailed on the daily chart.
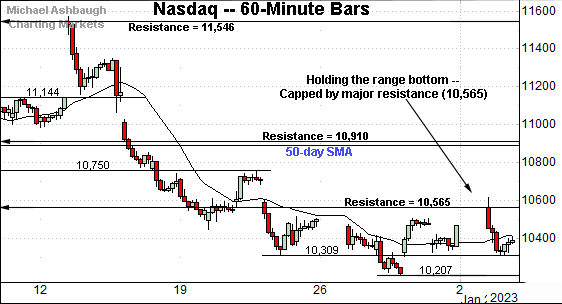
Against this backdrop, the Nasdaq Composite is also treading water.
Tactically, the prevailing two-week range is capped by major resistance (10,565) detailed previously.
Consider that Tuesday’s open (10,562) — also the 2023 open — effectively matched resistance. Selling pressure has at least initially surfaced in this area.
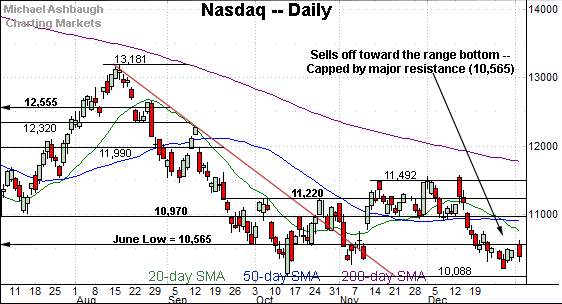
Widening the view to six months adds perspective.
On this wider view, the Nasdaq is digesting a downdraft from three-month highs.
The recent rally attempt has been comparably sluggish, and capped by major resistance (10,565). Bearish price action.
(As detailed previously, resistance matches the June low (10,565) and September low (10,572) respectively.)
Looking elsewhere, the Dow Jones Industrial Average remains the strongest benchmark.
Nonetheless, the index has asserted a lower plateau capped by the 50-day moving average, currently 33,284, and major resistance (33,240).
Against this backdrop, notable overhead broadly spans from about 33,240 to 33,420. (Also see the hourly chart.) Sustained follow-through atop this area would strengthen the intermediate-term bull case.
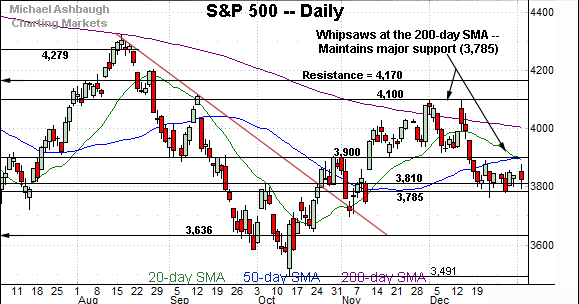
Meanwhile, the S&P 500 has flatlined of late, digesting a downdraft from major resistance (4,100).
Amid the downturn, the S&P has maintained major support (3,785) detailed previously. The December closing low (3,783), established Dec. 28, registered nearby.
(On a granular note, the 3,785-to-3,810 support encompasses the second-quarter close (3,785), the May low (3,810), the September Fed-induced inflection point (3,790) and the December closing low (3,783).)
The bigger picture
Exactly one year ago — on Jan. 4, 2022 — the S&P 500 registered its all-time high of 4,818.
Fast forward to the present, and Tuesday’s close — on Jan. 3, 2023 — registered at 3,824. The net result is a nearly one-year downturn spanning 994 points, or 20.6%.
Against this backdrop, the major U.S. benchmarks remain in divergence mode — each index is doing different things — though on balance, the prevailing bigger-picture bias remains comfortably bearish.
Moving to the small-caps, the iShares Russell 2000 ETF (IWM) is traversing a lower plateau.
The strong-volume mid-December downturn has been punctuated by a sluggish rally attempt, capped by the breakdown point (178.00). This area has drawn the “expected” selling pressure. (See the Dec. 20 review.)
Similarly, the SPDR S&P MidCap 400 ETF (MDY) has asserted a lower plateau.
In its case, the prevailing range is capped by the 50- and 200-day moving averages, an area matching the breakdown point (449.50).
Tactically, the 50-day moving average currently 449.44, closely matches the breakdown point (449.50). Follow-through atop this area would mark technical progress.
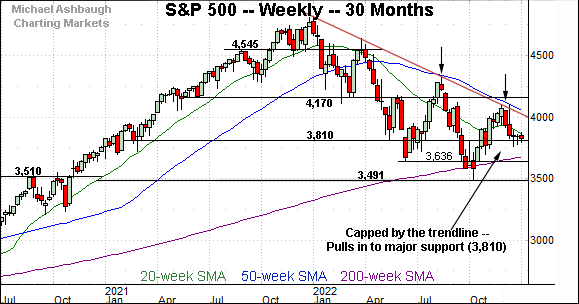
Returning to the S&P 500, this next chart is a weekly view spanning 30 months. Each bar on the chart represents one week.
As illustrated, the S&P 500 has extended a downturn from trendline resistance, a level closely tracking the 50-week moving average.
Recall the trendline is hinged to the S&P’s all-time high, established precisely one year ago, on Jan. 4, 2022.
Conversely, the prevailing downturn has been underpinned by major support — also illustrated below — in the 3,785-to-3,810 area. Delving deeper, the 200-week moving average, currently 3,674, is followed by the June low (3,636).
Returning to the S&P 500’s six-month view adds perspective.
As illustrated, the S&P staged a relatively aggressive downdraft from the December peak (4,100), and has subsequently flatlined at the turn of the year. Bearish momentum is intact, based on today’s backdrop.
But on a modestly positive note, the S&P has initially maintained major support — the 3,785-to-3,810 area — detailed repeatedly. (See the Dec. 20 review.)
The quality of the rally attempt from this area, to start the new year, may add color.
When gauging the rally attempt’s quality, major resistance matches the former breakdown point (3,900) and the 50-day moving average, currently 3,903.
Tactically, sustained follow-through atop the 3,900 area would signal a bullish-leaning intermediate-term bias. As always, the chances of a breakout improve to the extent the S&P holds relatively tightly to resistance.
More broadly, the S&P 500’s longer-term bias remains comfortably bearish based on today’s backdrop. Tactically, the 200-day moving average, currently 4,002, closely matches trendline resistance on the weekly chart. Eventual follow-through higher would raise the flag to a potentially consequential trend shift.
Editor’s Note: The next review will be published Tuesday, Jan. 10.


