Charting bullish follow-through, S&P 500 ventures atop 200-day average
Focus: Europe ETF clears 200-day average, Oracle Corp. and Merck stage late-year breakouts, IEV, ORCL, MRK, BBY
Technically speaking, the major U.S. benchmarks continue to trend higher, though against a backdrop that is not one-size-fits-all.
Amid the cross currents, the S&P 500 has ventured atop its marquee 200-day moving average, closing higher for the first time since early April. The rally attempt’s sustainability, and upside follow-through, remain open questions.
Editor’s Note: As always, updates can be directly accessed at https://chartingmarkets.substack.com.
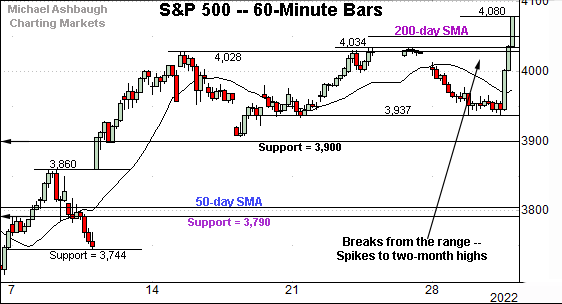
Before detailing the U.S. markets’ wider view, the S&P 500’s hourly chart highlights the past four weeks.
As illustrated, the S&P has broken out, knifing from a relatively tight three-week range.
In the process, the index has ventured atop the 200-day moving average, currently 4,048, a widely-tracked longer-term trending indicator.
Delving deeper, the breakout point — the 4,028-to-4,034 area — is followed by familiar support matching the 3,900 mark.
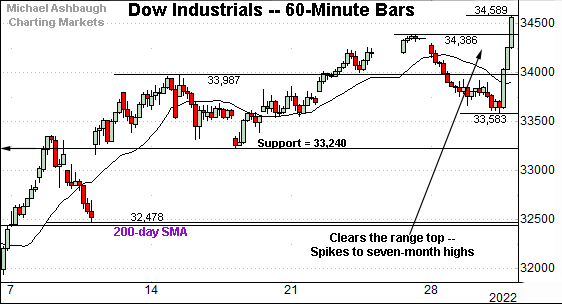
Meanwhile, the Dow Jones Industrial Average has knifed to seven-month highs.
More broadly, the prevailing uptrend has been underpinned by major support (33,240) and the 200-day moving average, areas also detailed on the daily chart.
(On a granular note, the Dow industrials registered a massive 1,006-point intraday range Wednesday amid the Fed Chairman’s well received Brookings Institution speech.)
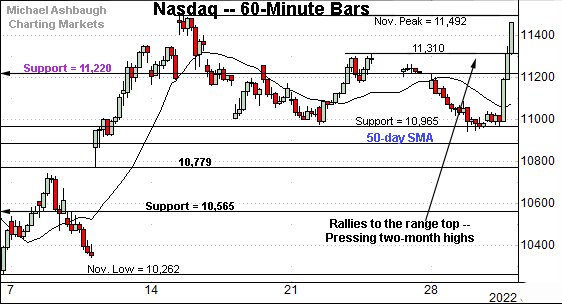
Against this backdrop, the Nasdaq Composite continues to lag behind the other benchmarks.
Nonetheless, the index knifed to its range top, rising to challenge two-month highs.
The prevailing three-week range has been underpinned by the 50-day moving average, currently 10,892.
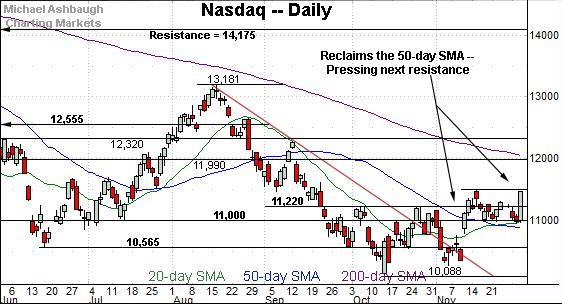
Widening the view to six months adds perspective.
On this wider view, the Nasdaq has rallied to challenge the November peak. Follow-through atop this area would mark a “higher high” confirming the intermediate-term uptrend.
Tactically, major support (11,220) is followed by the range bottom, an area roughly matching the 50-day moving average. Broadly speaking, the Nasdaq’s recovery attempt is intact barring a violation of the 10,890-to-11,000 area.
True to recent form, the Dow Jones Industrial Average remains strikingly stronger.
In fact, the index has knifed to seven-month highs.
Tactically, the breakout point (34,280) is followed by major support (33,240). Recall the mid-November low (33,239) matched support.
More broadly, the Dow has extended its rally atop the 200-day moving average.
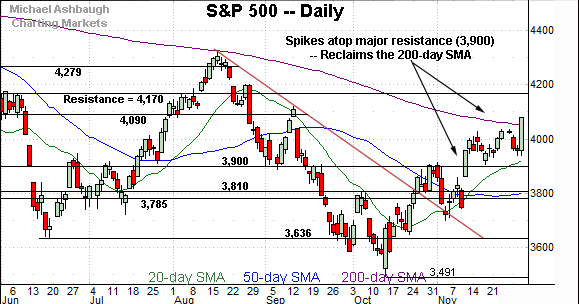
Meanwhile, the S&P 500 has staged a headline technical event.
Specifically, the index has reclaimed its 200-day moving average, currently 4,048, a widely-tracked longer-term trending indicator.
The prevailing upturn builds on the early-November rally atop the 3,900 mark. Delving deeper, the November upturn originates from trendline support.
The bigger picture
As detailed above, the major U.S. benchmarks have extended the late-year rally attempt though against a backdrop that remains far from one-size-fits-all.
On a headline basis, the S&P 500 has ventured atop its 200-day moving average while the Dow industrials have tagged seven-month highs. Elsewhere, the Nasdaq Composite continues to lag firmly behind.
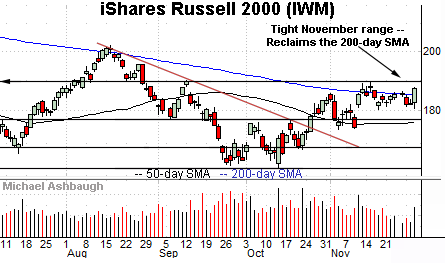
Moving to the small-caps, the iShares Russell 2000 ETF (IWM) has asserted a holding pattern.
Within the range, the small-cap benchmark is hugging its 200-day moving average, currently 185.07. On further strength, the three-month range top (189.90) marks familiar resistance.
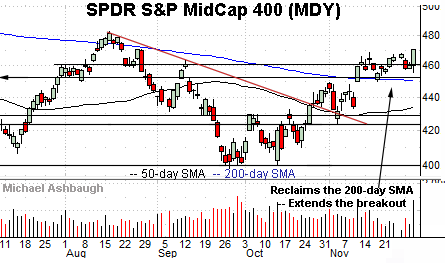
Meanwhile, the SPDR S&P MidCap 400 ETF (MDY) remains stronger than the Russell 2000.
As illustrated, the mid-cap benchmark has sustained a break atop the 200-day moving average.
This week’s slight follow-through has been fueled by increased volume to punctuate a tight three-week range. Constructive price action.
Market breadth registers bullish extremes
Beyond the charts, market breadth surged amid Wednesday’s rally, fueled by well received Federal Reserve policy language.
Against this backdrop, NYSE advancing volume surpassed declining volume by a nearly 9-to-1 margin.
As always, in a textbook world, two 9-to-1 up days — across about a seven-session window — reliably signals a material trend shift. (The early-2019 rally originated from two 9-to-1 up days across a precisely seven-session window.)
So in the current case, the S&P 500 has reclaimed its 200-day moving average amid a powerful 9-to-1 up day. A comparable upside follow-through day could register (or not) amid the influential mid-December inflation reports.
(On a granular note, the Nov. 10 rally illustrated below — the spike atop the 3,900 mark — registered amid slightly less than 7-to-1 positive breadth. While not textbook bullish price action, the S&P 500 has been acting well amid its rally attempt. The Nasdaq Composite has not.)
Returning to the S&P 500, the index concluded November with a headline event.
To reiterate, the index has knifed atop its 200-day moving average, raising the flag to a potential primary trend shift. The prevailing upturn punctuates an orderly range underpinned by the breakout point (3,900). Bullish price action.
Tactically, consecutive closes atop the 200-day moving average — combined with material upside follow-though, on the order of 1.0% to 1.5% or about 40 to 60 points — would strengthen the bull case.
But either way, the late-November spike confirms the intermediate-term uptrend originating from trendline support at the November low. The prevailing rally attempt is intact barring a violation of the breakout point (3,900).
Stray Notes
(Recall the August peak registered one point under the 200-day moving average, and the S&P 500 subsequently extended its downtrend.)
(Separately, the prevailing Fed-induced spike registers almost exactly one year after the Fed-induced market downdraft amid the late-November 2021 hawkish policy tilt. See the Dec. 1, 2021 review.)
Editor’s Note: Tuesday’s review was held up by technology issues. The next review will be published Tuesday, Dec. 6.
Watch List
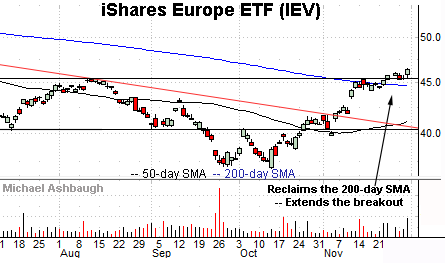
Drilling down further, the iShares Europe ETF (IEV) is acting well technically.
As illustrated, the shares have edged to five-month highs, clearing the August peak amid increased volume.
The upturn punctuates a tight two-week range — hinged to the steep early-November trendline breakout — laying the groundwork for potentially more decisive follow-through.
Tactically, the 200-day moving average, currently 44.68, is followed by deeper gap support (43.40). The prevailing rally attempt is intact barring a violation. (Also see the Nov. 17 review.)
Moving to specific names, Oracle Corp. (ORCL) is a well positioned large-cap name. (Yield = 1.6%.)
As illustrated, the shares have recently knifed to seven-month highs, clearing resistance matching the August peak.
The subsequent pullback has been flattish, fueled by decreased volume, and underpinned by the breakout point (79.90). Bullish price action.
Delving deeper, notice the 200-day moving average, currently 74.15, has marked an inflection point. The successful November retest signals a primary uptrend.
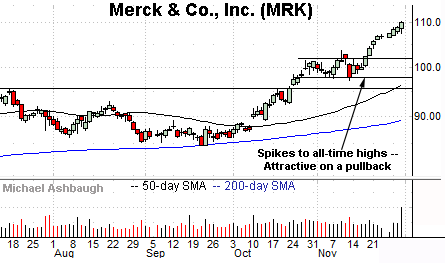
Looking elsewhere, Merck & Co., Inc. (MRK) is a Dow 30 component taking flight. (Yield = 2.7%.)
Technically, the shares have knifed to all-time highs, rising after positive late-stage trial results for the company’s cancer treatement, Keytruda. (Positive phase 3 trial results.)
Though near-term extended, and due to consolidate, the steep November rally is longer-term bullish. Tactically, the breakout point (101.90) marks a well-defined floor.
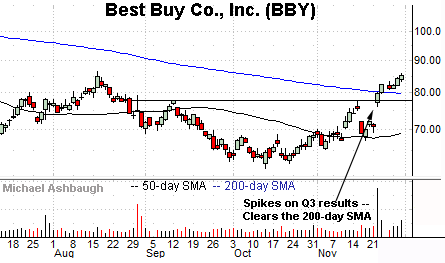
Finally, Best Buy Co., Inc. (BBY) is a large-cap specialty retailer coming to life.
Late last month, the shares gapped sharply higher, rising after the company’s strong third-quarter results. The breakout places the shares at three-month highs to punctuate a head-and-shoulders bottom.
Tactically, the 200-day moving average, currently 79.75, is followed by the deeper breakout point (77.50). The prevailing rally attempt is intact barring a violation.


