Charting a bullish reversal, S&P 500 reclaims the breakdown point (3,636)
Focus: Small- and mid-caps continue to diverge, Dow industrials reclaim 20-day average, Market internals remain a question mark
Technically speaking, the major U.S. benchmarks have knifed from the October low, rising amid a bullish reversal that gets mixed marks for style.
Against this backdrop, the S&P 500 has reclaimed its breakdown point (3,636) a key bull-bear battleground detailed previously. The week-to-date low (3,638) has registered nearby, and the S&P has since extended its rally attempt.
Editor’s Note: As always, updates can be directly accessed at https://chartingmarkets.substack.com.
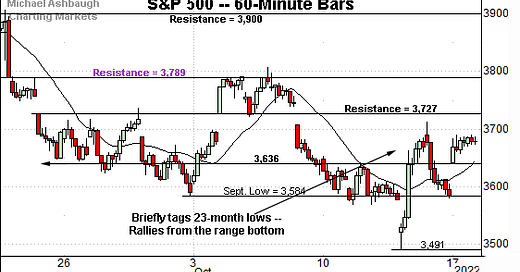
Before detailing the U.S. markets’ wider view, the S&P 500’s hourly chart highlights the past four weeks.
As illustrated, the S&P has reversed sharply from 23-month lows.
In the process, the index has reclaimed its breakdown point (3,636) an area also detailed on the daily chart. Monday’s session low (3,638) registered nearby.
On further strength, gap resistance (3,727) is followed by major overhead (3,789) — detailed repeatedly — an area established after the Federal Reserve’s policy statement.
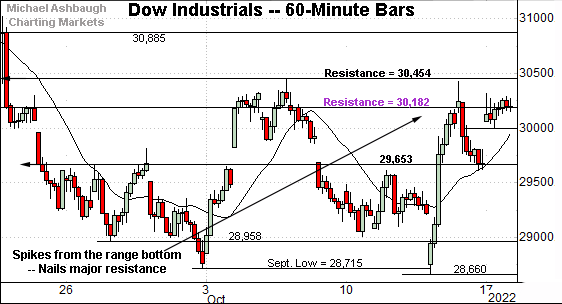
Meanwhile, the Dow Jones Industrial Average continues to strengthen slightly versus the other major benchmarks.
As illustrated, the index has knifed to major resistance (30,182) — detailed previously — outpacing the S&P 500.
Monday’s close (30,185) registered nearby.
The prevailing upturn punctuates a developing double bottom — the W formation — defined by the September and October lows. The response to the range top is worth tracking.
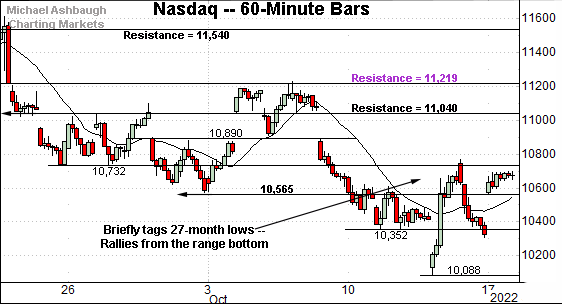
Against this backdrop, the Nasdaq Composite remains the weakest major benchmark.
As illustrated, the index has rallied nowhere near its corresponding resistance (11,219), an area defining the range top.
Nonetheless, the Nasdaq has reclaimed its breakdown point (10,565), an area also detailed below. Monday’s session low (10,569) registered nearby amid price action mirroring that of the S&P 500.
(Tactically, Nasdaq 10,565 corresponds with S&P 3,636 as illustrated on the daily charts below. Both areas define breakdown points, as well as the week-to-date low. Though the price action is technical — which is generally good — it also lends the rally attempt an engineered quality, which is not good.)
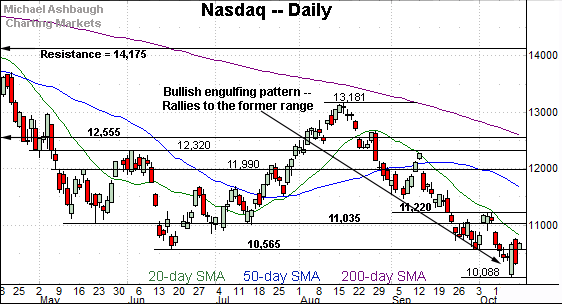
Widening the view to six months adds perspective.
On this wider view, the Nasdaq has reversed respectably from 27-month lows.
The initial spike marked a bullish engulfing pattern — the wide-range lighter bar — encompassing the real body, or opening and closing levels, of the prior two sessions.
Tactically, the reversal places the Nasdaq back atop its breakdown point (10,565). Monday’s session low (10,569) registered nearby.
On further strength, the 20-day moving average, currently 10,790, has defined recent near-term trends. (See the green trending indicator.)
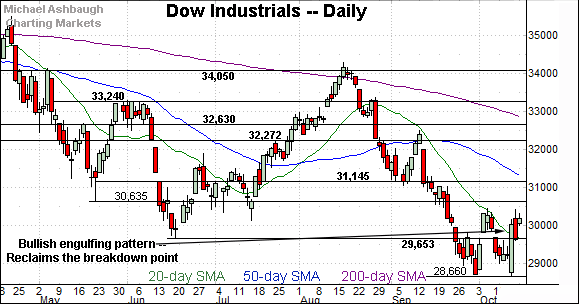
Looking elsewhere, the Dow Jones Industrial Average has rallied more aggressively, staging a massive bullish engulfing pattern encompassing the prior four sessions.
The sharp reversal places the Dow atop its 20-day moving average, a widely-tracked near-term trending indicator.
And here again, the index has reclaimed its breakdown point (29,653), an area detailed repeatedly. Last week’s close (29,634) registered nearby, and the index has followed through higher. (Also see the hourly chart.)
(On a granular note, the 20-day moving average, currently 29,654, happens to match the breakdown point (29,653).
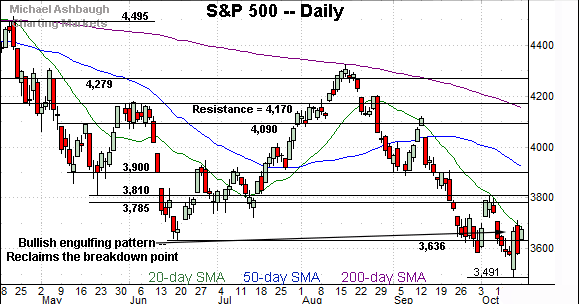
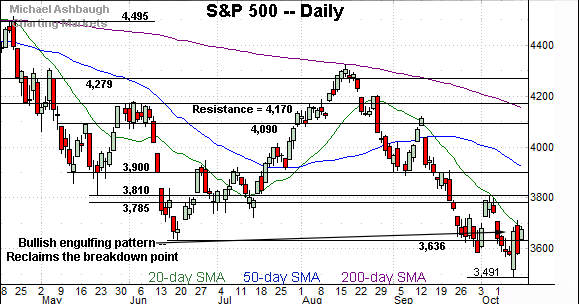
Meanwhile, the S&P 500 has knifed from 23-month lows, rising amid a bullish reversal encompassing the prior three sessions.
To reiterate, the rally places the S&P 500 back atop its breakdown point (3,636). Monday’s session low (3,638) registered nearby amid price action mirroring that of the Nasdaq.
Separately, the index is pressing its 20-day moving average, currently 3,677, an area that has defined recent near-term trends.
The bigger picture
As detailed above, the major U.S. benchmarks have rallied respectably from the October low.
On a headline basis, each index has registered a wide-range bullish engulfing pattern, rising to reclaim its first significant resistance — the S&P 3,636 and Nasdaq 10,565 areas stand out.
But perhaps unusually, the initial spike off the low — the Oct. 13 engulfing pattern — registered lukewarm breadth for the circumstances. That day, NYSE advancing volume surpassed declining volume by just a 4-to-1 margin. (A reading on the order of 9-to-1 would more convincingly signal a market reversal.)
To be sure, breadth has subsequently strengthened amid Monday’s upside follow-through, fueled by aggressive 13-to-1 positive internals.
As always, in a textbook world, two 9-to-1 up days — across about a seven-session window — would more reliably raise the flag to a major trend shift. (The early-2019 rally originated from two 9-to-1 up days across a precisely seven-session window.)
So the prevailing internals signal a question mark for now. At least pending a comparable follow-through session, or lack thereof.
Moving to the small-caps, the iShares Russell 2000 ETF (IWM) continues to strengthen sligthly versus the broader market.
As illustrated, the small-cap benchmark has maintained its range bottom — unlike the major U.S. benchmarks — rising from support amid a volume spike.
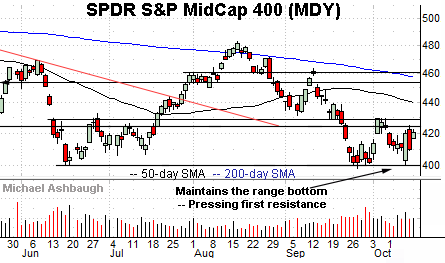
Similarly, the SPDR S&P MidCap 400 ETF (MDY) has maintained its range bottom, rising from support amid increased volume.
Slightly more broadly, recall the small- and mid-cap benchmark’s September low registered three sessions before the major benchmarks.
So the small- and mid-caps continue to show signs of stabilizing ahead of the broader market.
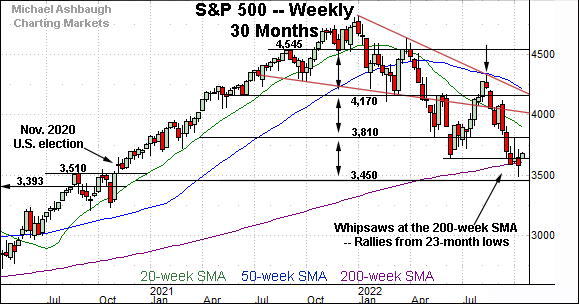
Returning to the S&P 500, this next chart is a weekly view spanning 30 months. Each bar on the chart represents one week.
As illustrated, the S&P has whipsawed at the 200-week moving average, currently 3,605.
Last week’s close (3,583) registered slightly under the longer-term trending indicator, though the index has reversed sharply from recent lows. (Two of the prior three weekly closes have registered nominally under the 200-week moving average — at 3,585 and 3,583 respectively.)
As detailed previously, prevailing retest of this area — across potentially several weeks — remains a “watch out.”
Slightly more broadly, the latest leg lower originates from major resistance (3,810). The October peak (3,807) has registered nearby.
(On a granular note, the S&P 500 has tagged the U.S. election-fueled breakout point (3,510) — detailed above — rising sharply from this area.)
Returning to the six-month view, the S&P 500 has reversed sharply from the October low.
In the process, the index has reclaimed its breakdown point (3,636), an area defining its first notable overhead.
From current levels, the 20-day moving average, currently 3,677, is followed by familiar gap resistance (3,727). (Also see the hourly chart.)
Sustained follow-through atop this area would signal a potentially viable near-term rally attempt.
On further strength, the 3,810 resistance is followed by major overhead matching the 3,900 mark. Eventual follow-through higher would raise the flag to an intermediate-term trend shift. (The 50-day moving average is descending toward resistance.)
Beyond specific levels, the S&P 500’s longer-term bias remains bearish based on today’s backdrop. No new setups today.
Also see Oct. 13: Charting a bull-bear battle, S&P 500 challenges the breakdown point (3,636).
Also see Sept. 27: S&P 500 challenges last-ditch support (3,636) as Volatility Index signals stubborn investor complacency.

