


Charting a bullish 2024 start, S&P 500 asserts holding pattern
Focus: Nasdaq and Russell 2000 maintain the breakout point

Technically speaking, the major U.S. benchmarks are off to a sideways, but still largely bullish, 2024 start.
On a headline basis, each big three benchmark has asserted a one-month range, digesting an unsually powerful late-2023 rally. The charts below add color:
Editor’s Note: As always, updates can be directly accessed at https://chartingmarkets.substack.com.
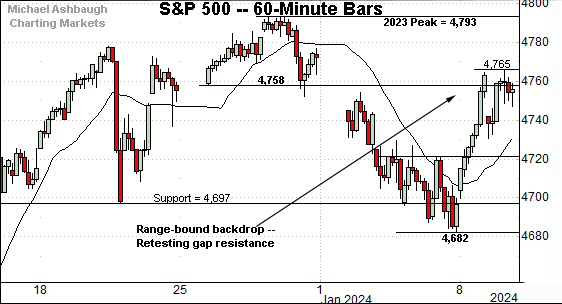
Before detailing the U.S. markets’ wider view, the S&P 500’s hourly chart highlights the past four weeks.
As illustrated, the S&P 500 has registered jagged, but largely range-bound, turn-of-the-year price action. The prevailing one-month range is relatively narrow, spanning 111 points, or about 2.4%.
Tactically, a retest of gap resistance (4,758) remains underway.
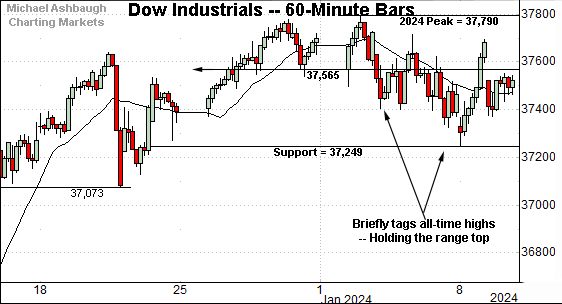
Meanwhile, the Dow Jones Industrial Average is off to a comparably flattlish 2024 start.
In its case, the prevailing three-week range spans just 540 points, or less than 1.5%.
Tactically, the Jan. low (37,250) defines the range bottom, and marks a near-term inflection point.
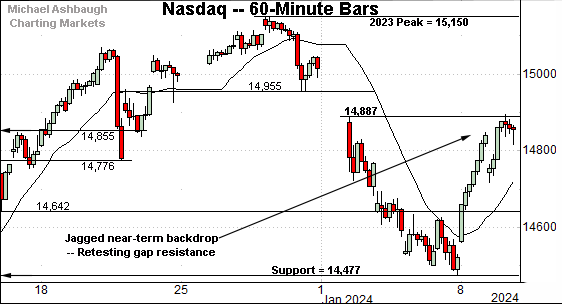
Against this backdrop, the Nasdaq Composite’s turn-of-the-year price action is comparably volatile.
Its one-month range spans 673 points, marking a wider 4.6% band.
Tactically, the prevailing whipsaw places gap resistance (14,887) under siege.
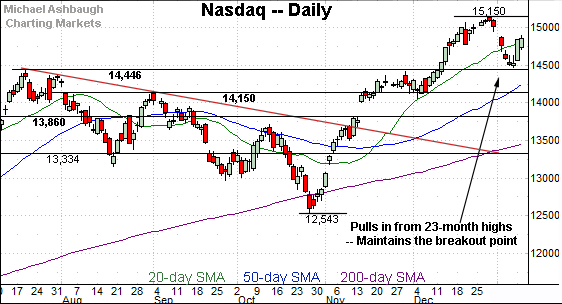
Widening the view to six months adds perspective.
On this wider view, the Nasdaq has sustained the December breakout.
Tactically, the recent downturn has been underpinned by the breakout point (14,446), a familiar floor detailed previously.
The Jan. low (14,477) has registered slightly above support amid a successful retest.
Delving deeper, the ascending 50-day moving average, currently 14,292, is followed by the 14,150 area. The Nasdaq’s intermediate-term bias remains bullish barring a violation.
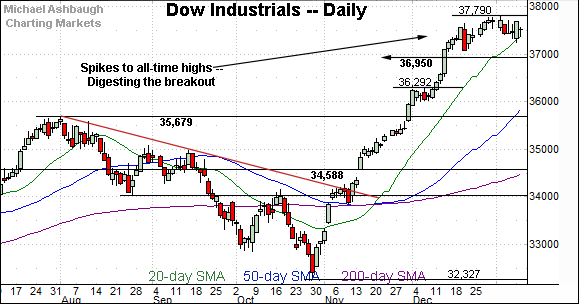
Looking elsewhere, the Dow Jones Industrial Average is digesting a decisive break all-time highs.
The prevailing flag-like pattern — the tight range, hinged to the steep rally off the October low — signals still muted selling pressure, laying the groundwork for potential upside follow-through.
Tactically, the 20-day moving average, currently 37,420, is followed by support at 37,250 (see the hourly chart) and a deeper floor matching the 2022 peak (36,952).
The Dow has not closed under its 20-day moving average — a widely-tracked near-term trending indicator — since Nov. 1. (See the Nov. 8 review.)
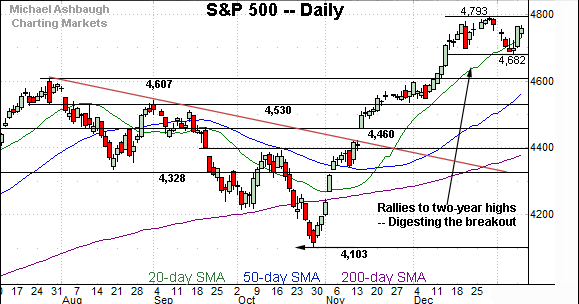
Against this backdrop, the S&P 500 has sustained rally to two-year highs.
Here again, the prevailing flag-like pattern — the relatively tight range — is hinged to a steep rally off the October low.
Tactically, the 50-day moving average, currently 4,577, is rising toward the breakout point (4,607).
The bigger picture
As detailed above, the major U.S. benchmarks are acting well technically.
Each big three benchmark has registered largely sideways turn-of-the-year price action, to punctuate a decisive mid-November trend shift.

Moving to the small-caps, the iShares Russell 2000 ETF (IWM) has sustained a break to 21-month highs.
In the process, the small-cap benchmark has maintained its breakout point, a level matching the Sept. peak (191.86). The Jan. low (192.00) has registered nearby amid a successful retest.
One near-term concern, is the prevailing rally from support has been flat, and fueled by distinctly decreased volume. Particularly considering normal post-holiday price action is back in play.
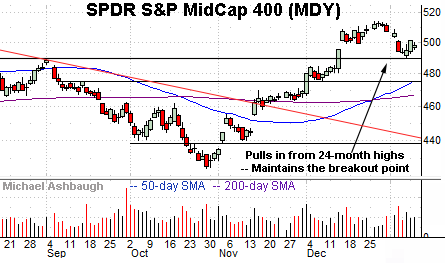
Similarly, the SPDR S&P MidCap 400 ETF (MDY) has maintained its breakout point, matching the Sept. peak (489.20). Here again, the Jan. low (490.67) has registered nearby.
Combined, the small- and mid-cap benchmarks have sustained their December breakouts, thus far maintaining well-defined support. Constructive price action.

Returning to the S&P 500, the index has asserted a one-month range, digesting the massive late-2023 rally. Recall the steep rally off the October low registered highly unusual bullish momentum.
Bullish highlights include the mid-November trendline breakout — the gap atop the trendline — fueled by unusual 9-to-1 positive breadth. (NYSE advancing volume surpassed declining volume by a 9-to-1 margin.)
Fast forward four weeks, and the S&P staged a powerful two standard deviation December breakout, punctuated by five straight closes atop the 20-day volatility bands. (The volatility bands are not illustrated, though two consecutive closes atop the bands mark a reliably bullish signal.)
Also simply consider the headline number: The S&P concluded 2023 with a nine-week rally spanning as much as 690 points, or 16.8%.
So against this backdrop, the S&P 500’s recent sideways price action is constructive, marking the “expected” consolidation phase. These remain the traits of a legitimate bull market that may still be in its relatively early stages.
Tactically, the 50-day moving average, currently 4,577, is rising toward the breakout point (4,607). An eventual violation would raise a question mark. Delving deeper, the 4,530 area likely marks a last-ditch floor based on today’s backdrop.
As always, it’s not just what the markets do, it’s how they do it. But generally speaking, the S&P 500’s bigger-picture bias remains bullish barring a violation of the 4,530 area. The response to the next batch of inflation data will likely add color.
Also see Dec. 20: Charting a bull-market breakout, S&P 500 takes flight.
Also see Nov. 21: Charting a primary trend shift, S&P 500 clears key trendline amid 9-to-1 up day.
Also see Nov. 8: Charting a bullish reversal, Nasdaq challenges key trendline.