


Charting a bull-market breakout, S&P 500 takes flight
Focus: Major benchmarks stage two standard deviation breakouts, Small- and mid-caps reach less-charted territory

Technically speaking, the major U.S. benchmarks continue to take flight, rising amid a bull market that may still be in its relatively early stages.
Against this backdrop, each big three U.S. benchmark has confirmed its primary uptrend. The charts below add color:
Editor’s Note: As always, updates can be directly accessed at https://chartingmarkets.substack.com.
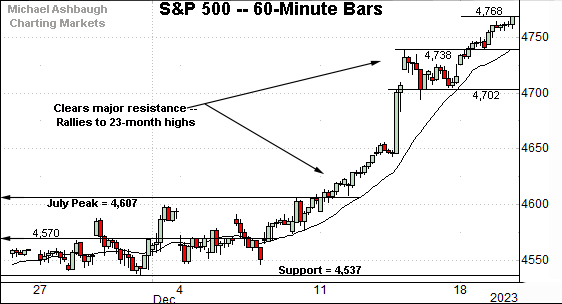
Before detailing the U.S. markets’ wider view, the S&P 500’s hourly chart highlights the past four weeks.
As illustrated, the S&P 500 has once again taken flight, knifing to 23-month highs.
Recent follow-through punctuates a decisive break atop the July peak (4,607). From current levels, the 4,740 and 4,700 areas mark near-term support points.
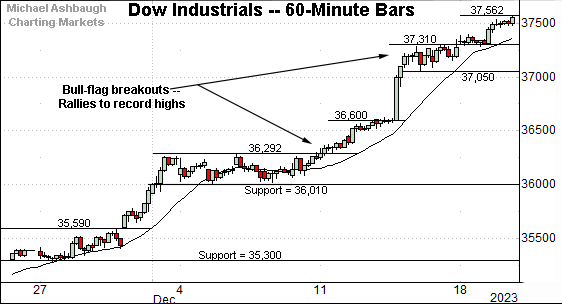
Meanwhile, the Dow Jones Industrial Average continues to take flight, knifing to all-time highs.
The prevailing upturn has been punctuated by flag patterns — the tight ranges — and upside follow-through. Sellers remain absent, driving prices higher. (Prices rise when sellers are absent, in an effort to attract new sellers.)
Tactically, the 37,310 area is followed by major support broadly spanning from 36,950 to 37,050. (Also see the daily chart.)

Against this backdrop, the Nasdaq Composite has also taken flight, rising to tag the 15,000 mark.
Tactically, the breakout point — the 14,425-to-14,445 area — pivots to major support, also detailed on the daily chart below.
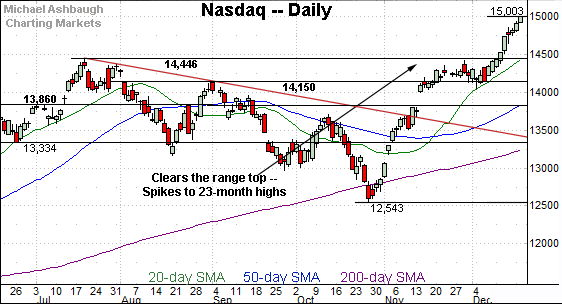
Widening the view to six months adds perspective.
On this wider view, the Nasdaq broken out, tagging 23-month highs.
From current levels, the breakout point — the 14,445 area — marks the first notable floor.
More broadly, the prevailing upturn marks an unusually powerful two standard deviation breakout, encompassing five straight closes atop the 20-day volatility bands. (The volatility bands (not illustrated) are also known as Bollinger bands.) Though near-term extended, and due to consolidate at some point, the aggressive spike likely lays the groundwork for longer-term follow-through.
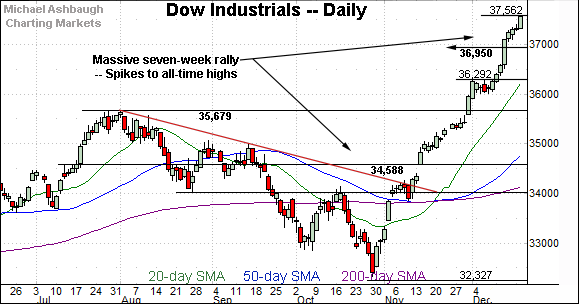
Looking elsewhere, the Dow Jones Industrial Average has extended its breakout, knifing to all-time highs.
Amid the upturn, the index has spiked more than 5,000 points across less than two months.
Tactically, the 36,950 area marks notable support, a level matching the Dow’s former all-time high (36,952) established Jan. 2022.

Against this backdrop, the S&P 500 has spiked to 23-month highs.
Recent follow-through punctuates a tight three-week range, hinged to the steep November rally. (Recall the gap atop 4,460 was fueled by powerful 9-to-1 market breadth. See the Nov. 21 review.)
And like the Nasdaq, the S&P 500’s December spike marks a statistically unusual two standard deviation breakout, encompassing five straight closes atop the 20-day volatility bands. (The Dow industrials’ breakout has encompassed two consecutive closes atop the 20-day bands. Combined, late-year bullish momentum has been unusually powerful, and borderline historic in spots.)
The bigger picture
As detailed above, the major U.S. benchmarks continue to take flight, building on a mid-November trend shift.
In the process, each benchmark has confirmed its primary uptrend, rising amid statistically powerful bullish momentum.
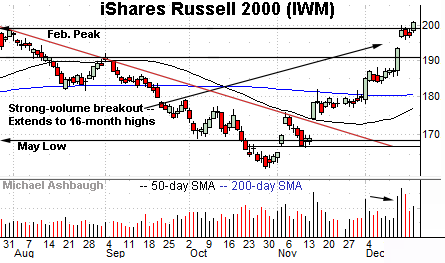
Moving to the small-caps, the iShares Russell 2000 ETF (IWM) has extended its December breakout, tagging 16-month highs.
Recent strength has been fueled by another volume spike, building on the strong-volume November trendline breakout. Bullish price action.
Tactically, the 199.20 area marks a notable floor, closely matching the February and July peaks.
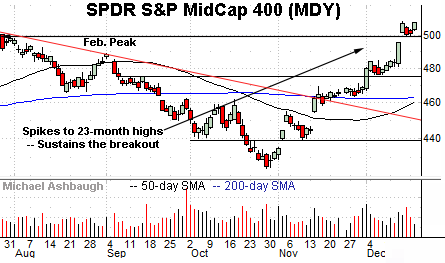
Meanwhile, the SPDR S&P MidCap 400 ETF (MDY) has sustained a decisive break to 23-month highs.
Here again, recent strength builds on a mid-November trendline breakout. Tactically, the 499.20 area marks first support.
Combined, the small- and mid-caps have both reached much less-charted territory, opening the path to potentially material upside follow-through. As reference, the Russell 2000’s all-time high, established Nov. 2021, rests another 21% above current levels. Meanwhile, the Dow industrials have already registered record highs.
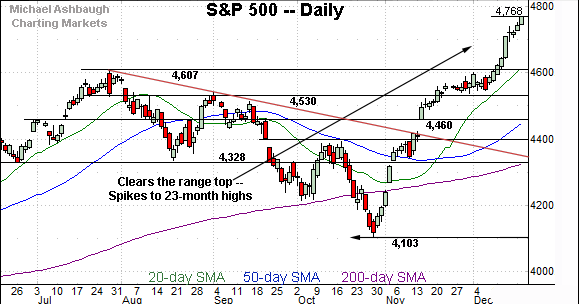
Returning to the S&P 500, the index has taken flight.
The December spike punctuates a tight three-week range — a flag-like pattern, of sorts — building on the mid-November trendline breakout.
Amid the upturn, the S&P 500 continues to register highly unusual bullish momentum. The index is vying to extend a stretch of five straight closes atop the 20-day volatility bands. (Generally speaking, consecutive closes atop the bands mark a reliably bullish signal.)
Also recall the mid-November gap — which signaled a trend shift — registered amid a rare 9-to-1 up day. (NYSE advancing volume surpassed declining volume by a 9-to-1 margin amid the gap atop the trendline.)
So collectively, the late-2023 price action carries the traits of a legitimate bull market. And the rally arguably remains in its relatively early stages as measured by time and price. Time will tell.
Tactically, volume will likely dry up toward the turn of the year, and material trend shifts rarely occur without volume. The immediate backdrop favors sideways to higher price action.
Beyond year-end, the risk is that January (the new tax year) invites profit-taking to punctuate the powerful late-2023 spike.
Tactically, the S&P’s breakout point (4,607) marks major support, and is followed by a floor in the 4,530-to-4,535 area. The S&P 500’s intermediate- to longer-term bias remains firmly-bullish barring a violation of these areas.
Also see Dec. 5: Charting market rotation, S&P 500 digests massive late-year rally.
Also see Nov. 21: Charting a primary trend shift, S&P 500 clears key trendline amid 9-to-1 up day.
Also see Nov. 8: Charting a bullish reversal, Nasdaq challenges key trendline.