Charting a bull-trend pullback, S&P 500 tags near-term support
Focus: Russell 2000 digests unusually aggressive November break atop the 20-day volatility bands
U.S. stocks are lower midday Wednesday, pressured amid heightened inflation concerns after a report signaling October consumer prices rose 6.2%, the fastest pace in 30 years.
Against this backdrop, each big three U.S. benchmark has reversed modestly from recent record highs, amid bigger-picture technicals that remain comfortably bullish.
Editor’s Note: As always, updates can be directly accessed at chartingmarkets.substack.com.
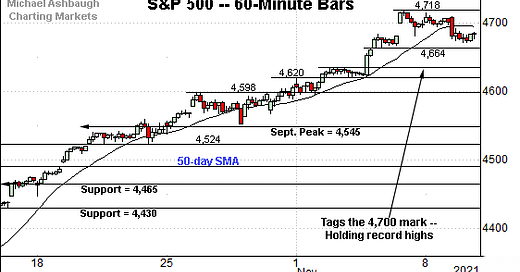
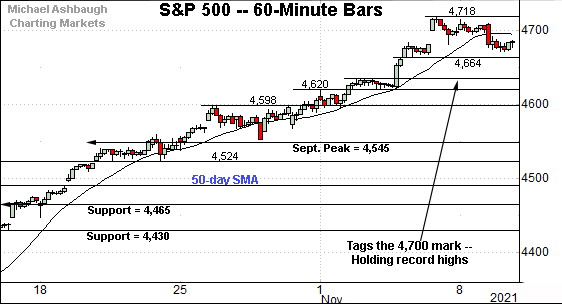
Before detailing the U.S. markets’ wider view, the S&P 500’s hourly chart highlights the past four weeks.
As illustrated, the S&P is digesting its latest break to record territory.
Tactically, near-term support (4,664) — detailed previously — is followed by the early-month breakout point (4,635).
Wednesday’s early session low (4,663) has closely matched the former.
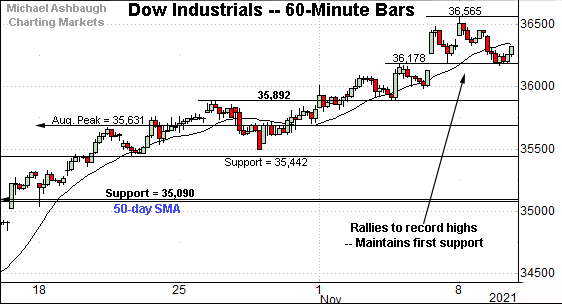
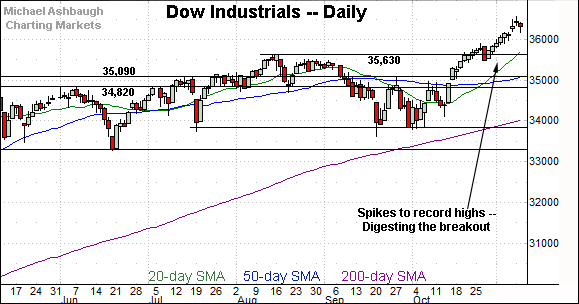
Similarly, the Dow Jones Industrial Average is digesting its latest break to record highs.
Here again, the index has initially maintained near-term support (36,178), detailed previously.
Consider that Tuesday’s session low (36,173) — also the week-to-date low — registered nearby.
Delving deeper, the breakout point (35,892) marks firmer support. (Recall last Wednesday’s session low (35,891) closely matched the breakout point.)
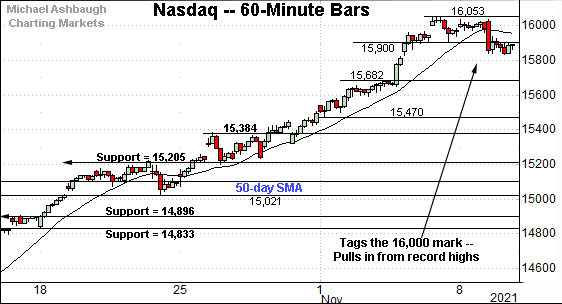
Against this backdrop, the Nasdaq Composite is also generally holding record highs.
Tactically, the 15,900 area remains an inflection point.
Delving deeper, the early-November breakout point (15,682) marks a near-term floor.
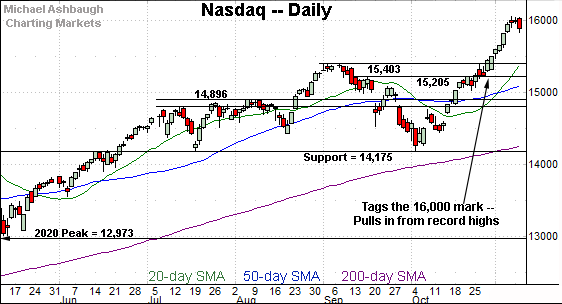
Widening the view to six months adds perspective.
On this wider view, the Nasdaq is digesting an unusually aggressive 3.7% technical breakout. The strong November start confirms the primary uptrend.
Tactically, near-term support remains poorly-defined. The Nasdaq’s breakout point — the 15,384-to-15,403 area — marks the first notable floor.
Conversely, an intermediate-term target continues to project to 16,550, an area initially detailed Oct. 27.
Looking elsewhere, the Dow Jones Industrial Average has registered a 2.2% breakout.
Here again, the aggressive follow-through confirms the blue-chip benchmark’s primary uptrend.
Though still near-term extended — and a consolidation phase is underway — the nearly straightline November spike is longer-term bullish.
An intermediate-term target continues to project to the 37,420 area.
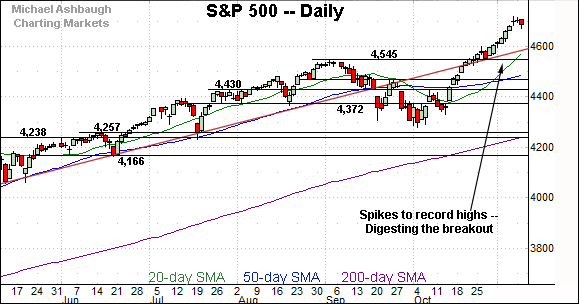
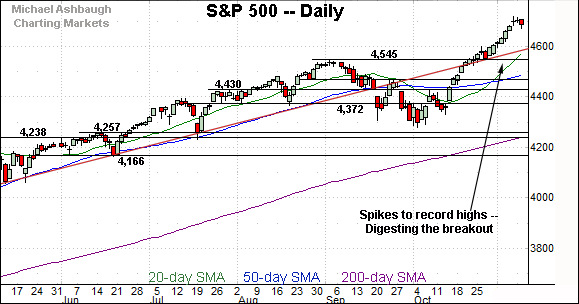
Meanwhile, the S&P 500 is digesting an aggressive 3.4% technical breakout.
Recall the strong November start originates from trendline support roughly matching the breakout point (4,545).
The bigger picture
As detailed above, the major U.S. benchmarks have taken flight.
In the process, each big three benchmark has confirmed its primary uptrend amid aggressive breakouts ranging from 2.2% (the Dow industrials) to 3.7% (the Nasdaq Composite).
Generally speaking, a breakout on the order of 1.0% would be sufficient to confirm the primary uptrend.
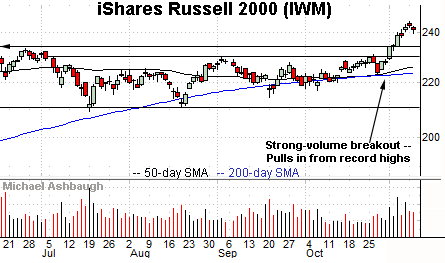
Moving to the small-caps, the iShares Russell 2000 ETF has staged a 3.4% November breakout.
And unlike the big three U.S. benchmarks, the Russell’s 2000’s rally has marked a truly unusual two standard deviation breakout, encompassing six straight closes atop the 20-day volatility bands. (See this link for chart.)
As always, consecutive breaks atop the bands signal the benchmark is near-term overbought. A cooling-off period is due, and seems to be underway.
But more importantly, the prevailing upturn has been fueled by extreme bullish momentum, likely laying the groundwork for longer-term gains.
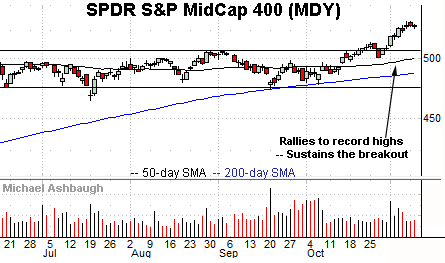
Similarly, the SPDR S&P MidCap 400 ETF is traversing previously uncharted territory.
As detailed repeatedly, the November breakout punctuates a prolonged range, opening the path to potentially material upside follow-through.
(On a granular note, the MDY has registered a single close atop the 20-day volatility bands amid still strong, but comparably less aggressive, follow-through.)
Placing a finer point on the S&P 500, the index is digesting a strong November start.
To reiterate, near-term support (4,664) — detailed previously — is followed by the early-month breakout point (4,635).
Wednesday’s early session low (4,663) has closely matched the former.
Separately, the prevailing downturn punctuates the S&P’s first sustained pullback under the 20-hour moving average in more than one month.
More broadly, the S&P 500 has indeed stalled for the near-term in the wake of an aggressive 3.4% technical breakout.
The index concluded last week with a doji — detailed Monday — a pattern signaling indecision as to the near-term market direction.
Against this backdrop, this week’s sideways price action has registered amid still comparably muted selling pressure. Constructive price action.
Tactically, trendline support, circa 4,590, is followed by the firmer breakout point (4,545). A sustained posture atop this area signals a bullish intermediate-term bias.
Conversely, an intermediate-term target projects to the 4,775-to-4,790 area, as detailed repeatedly. The November peak (4,718) has thus far registered within striking distance, about 1.2% under the target.
No new setups today.

