Charting a bull-bear stalemate, S&P 500 sustains slight trendline breakout
Focus: Influential sectors continue to challenge major resistance; Financials, transports and Nasdaq 100
Technically speaking, the major U.S. benchmarks have staged a stealth January rally attempt, rising as volatility recedes to start the new year.
Against this backdrop, the S&P 500 has sustained a modest trendline breakout, also notching four straight closes atop the 200-day moving average.
Editor’s Note: As always, updates can be directly accessed at https://chartingmarkets.substack.com.
Before detailing the U.S. markets’ wider view, the S&P 500’s hourly chart highlights the past four weeks.
As illustrated, the S&P continues to broadly hold one-month highs.
This week’s relatively shallow pullback has been underpinned by the 200-day moving average, currently 3,959, and familiar near-term support (3,950).
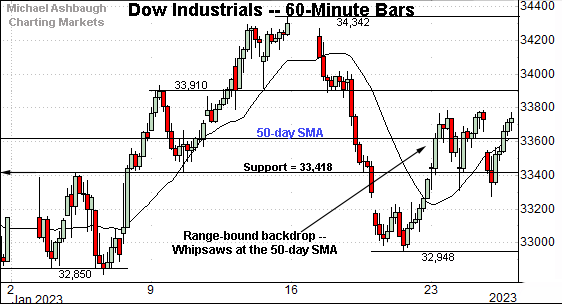
Meanwhile, the Dow Jones Industrial Average remains in divergence mode, lagging behind the other benchmarks on this near-term view.
Tactically, the blue-chip benchmark continues to whipsaw near the 50-day moving average, currently 33,617.
Delving deeper, the 33,420 area marks a notable floor.
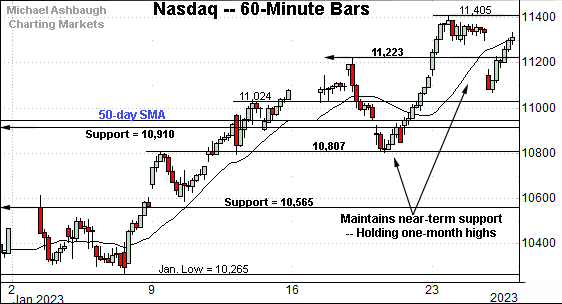
Against this backdrop, the Nasdaq Composite is holding one-month highs.
Its latest leg higher originates from familiar support (10,807) detailed previously. Recall last week’s low (10,804) registered nearby.
Combined, the late-January price action remains rotational, signaling a move toward “growth” and away from “value” for now.
(On a granular note, last week’s high (11,223) matched major resistance (11,220) an area detailed on the daily chart below.)
Widening the view to six months adds perspective.
On this wider view, the Nasdaq is digesting a break to one-month highs. Three consecutive closes have registered atop the breakout point (11,220).
From current levels, next resistance (11,492) — detailed previously — is closely followed by the descending 200-day moving average, currently 11,515.
The week-to-date peak (11,494) — established early Thursday — has closely matched resistance. Eventual follow-through atop this area would raise the flag to a primary trend shift.
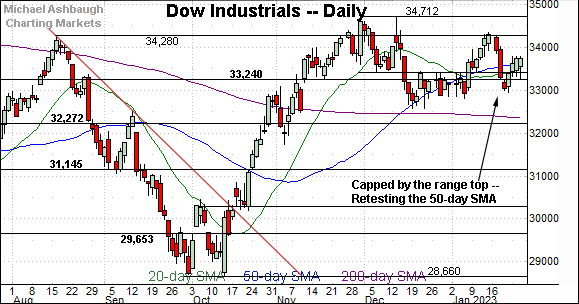
Looking elsewhere, the Dow Jones Industrial Average remains the strongest benchmark, in the broad sweep, though it has diverged in recent sessions.
Recall the Dow is not tagging one-month highs along with the Nasdaq and the S&P 500.
Instead, the index is hugging its 50-day moving average, currently 33,617, an area also detailed on the hourly chart. Delving deeper, a notable floor broadly spans from about 33,240 to 33,420.
Meanwhile, the S&P 500 has sustained a modest trendline breakout.
Separately, the index has notched notched four straight closes atop the 200-day moving average, currently 3,959, its longest stretch since March.
Slightly more broadly, the prevailing upturn originates from major support (3,900), a bull-bear fulcrum detailed repeatedly. Last week’s closing low (3,899) matched support.
The bigger picture
As detailed above, the major U.S. benchmarks have staged a stealth January rally attempt, rising amid receding volatility to start the year.
Against this backdrop, the S&P 500 has sustained its trendline breakout, also notching three straight closes atop the 4,000 mark.
(Monday’s initial trendline breakout has been punctuated by modest daily downturns, less than three points Tuesday, and less than one point Wednesday. Selling pressure remains muted.)
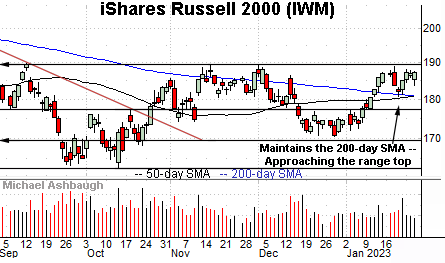
Moving to the small-caps, the iShares Russell 2000 ETF (IWM) is holding its range top.
As detailed repeatedly, the 189.55-to-189.90 area marks major resistance.
The week-to-date peak (189.85) — established early Thursday — has matched resistance.
Tactically, a breakout attempt is in play barring a violation of the 180.75 area. Also recall the pending golden cross — or bullish 50-day/200-day moving average crossover — an event that will likely signal this week.
Similarly, the SPDR S&P MidCap 400 ETF (MDY) is pressing its range top.
Tactically, the 475.15 area marks major resistance. (See the Dec. peak (475.17) and Aug. gap (475.15).) Recall a breakout would punctuate a cup-and-handle defined by the September and December lows.
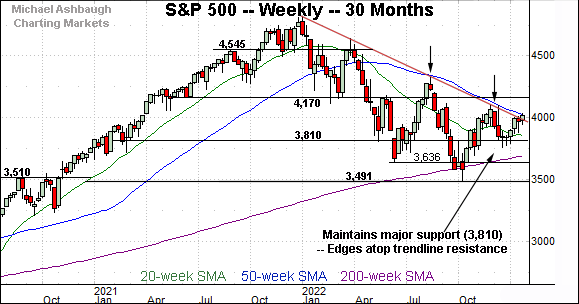
Returning to the S&P 500, this next chart is a weekly view spanning 30 months. Each bar on the chart represents one week.
As illustrated, the S&P 500 continues to challenge trendline resistance, a level hinged to the S&P’s all-time high, established Jan. 4, 2022.
Against this backdrop, the index has yet to register a weekly close atop the trendline.
So the S&P 500 will be vying Friday to notch its first weekly close atop the trendline in nearly 13 months. (Also recall the trendline roughly tracks the 50-week moving average, currently 4,030.)
Narrowing to the six-month view adds perspective.
On this daily chart, the S&P 500 has notched three straight closes modestly atop trendline resistance.
The slight breakout dovetails with four consecutive closes atop the 200-day moving average, the S&P’s longest stretch since March.
Against this backdrop, the prevailing upturn continues to get mixed marks for style.
As detailed previously, a major trend shift would ideally be punctuated by an aggressive move as measured by price, volume, breadth and sector participation. Each metric is lacking amid the current breakout, conspicuously so, when factoring for the reversal of a prolonged one-year downtrend.
Nonetheless, the breakout’s initial sustainability, amid thus far muted immediate selling pressure, is technically constructive.
As it applies to the primary (longer-term) trend, a bull-bear stalemate remains in play. The weekly close, and Tuesday’s monthly close, may add color.
But amid the stalemate, the S&P 500’s intermediate-term rally attempt is intact barring a violation of the 3,900 mark. Recall last week’s closing low (3,899) matched major support, a familiar bull-bear fulcrum detailed repeatedly. (See the Jan. 12 review.)
Editor’s Note: The next review will be published Wednesday, Feb. 1.
Watch List — Headline sector tests remain in play
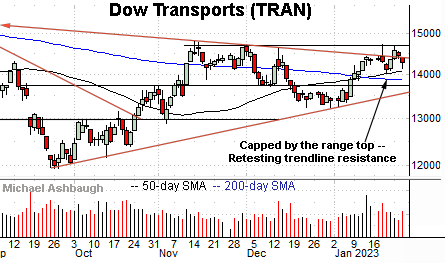
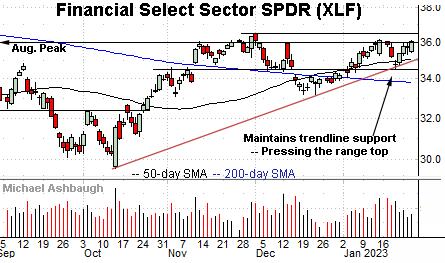
Drilling down further, potentially consequential technical tests remain in play across influential sectors. Three groups — initially detailed Jan. 24 — exemplify the prevailing backdrop:
To start, the Dow Transports (TRAN) seem to be rattling the cage on a breakout.
Tactically, trendline resistance is closely followed by a nearly five-month range top. A rally above the range top — the 14,690 area — would mark a material “higher high” confirming the group’s recent trend shift.
Conversely, the 50- and 200-day moving averages pivot to support. The group’s breakout attempt is intact barring a violation of this area.
Here again, the prevailing technical test has thus far concluded with a bull-bear stalemate.
Similarly, the Financial Select Sector SPDR (XLF) has reached a key technical test.
In its case, the group is challenging a nine-month range top broadly spanning from about 36.00 to 36.50. (See the Aug. peak (35.97), the Nov. closing peak (36.31) and the Dec. peak (36.49).)
The prevailing upturn originates from trendline support. Tactically, a breakout attempt remains in play barring a violation of the 34.55 area.
Finally, the Invesco QQQ Trust (QQQ) tracks the Nasdaq 100 Index offering a large-cap technology sector proxy.
As illustrated, the QQQ has challenged trendline resistance across three straight sessions. The trendline is closely followed by the 200-day moving average, currently 292.70.
Follow-through atop the 200-day would raise the flag to a longer-term trend shift. Tactically, a breakout attempt remains in play barring a violation of the 275-to-278 area.
More broadly, recall the developing double bottom defined by the October and December lows.


