Charting a bull-bear battle, S&P 500 nails trendline resistance
Focus: Dow industrials tag the range top, Nasdaq nails major resistance (11,220)
Technically speaking, the U.S. benchmarks’ January rally attempt has reached major resistance in recent sessions.
On a headline basis, the S&P 500 has nailed an important trendline — matching the 4,000 area — while the Dow Jones Industrial Average has tagged its range top (34,280). The pending selling pressure near resistance, or lack thereof, should be a useful bull-bear gauge.
Editor’s Note: As always, updates can be directly accessed at https://chartingmarkets.substack.com.
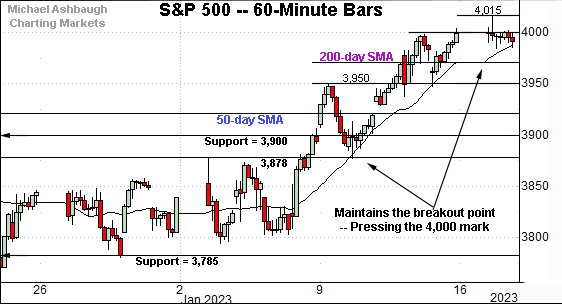
Before detailing the U.S. markets’ wider view, the S&P 500’s hourly chart highlights the past four weeks.
As illustrated, the S&P has extended its breakout, rising to tag the 4,000 mark. (The 4,000 mark matches an important trendline on the weekly and daily charts.)
From current levels, the 200-day moving average, currently 3,975, is followed by near-term support (3,950).
Delving deeper, the prevailing leg higher originates from the breakout point (3,878).
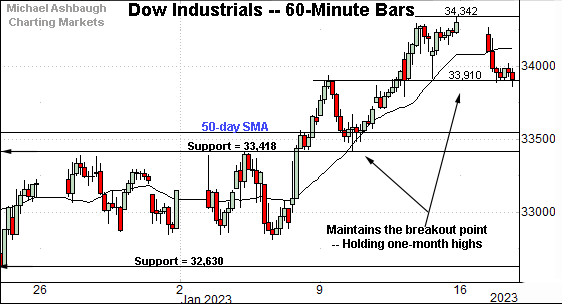
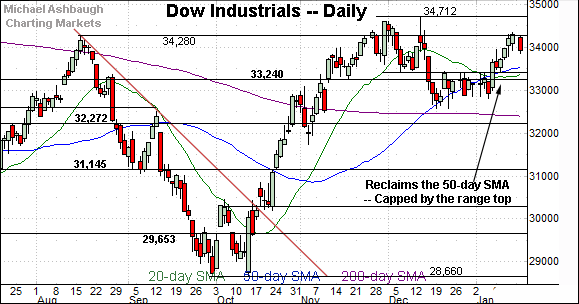
Similarly, the Dow Jones Industrial Average has tagged one-month highs.
Tactically, near-term support (33,910) is followed by the 50-day moving average, currently 33,565.
Delving deeper, the recent upturn originates from the breakout point (33,418) detailed previously. (See for instance, the Jan. 4 review.)
Last week’s low (33,421) registered nearby.
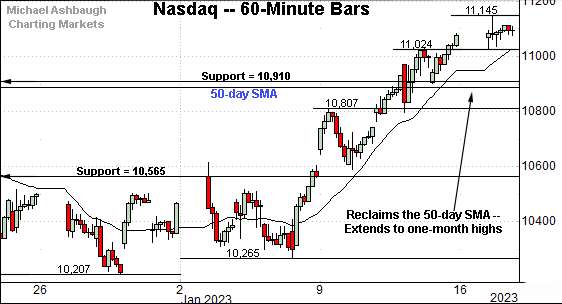
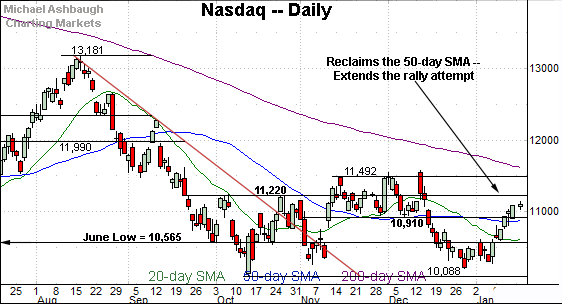
Against this backdrop, the Nasdaq Composite has also broken out.
Amid the upturn, the index has placed distance atop the 50-day moving average, currently 10,890.
From current levels, the 10,890-to-10,910 area marks a notable floor.
Widening the view to six months adds perspective.
On this wider view, the Nasdaq has extended its January rally attempt.
The prevailing upturn places major resistance (11,220) — detailed repeatedly — within view.
Wednesday’s early session high (11,223) — also the week-to-date high — has matched resistance.
Conversely, recall the 10,910 support roughly matches the 50-day moving average. A sustained posture atop this area (10,910) signals a bullish-leaning intermediate-term bias. (See the aggressive November break atop 10,910, and December downdraft lower.)
Looking elsewhere, the Dow Jones Industrial Average remains the strongest major benchmark.
Tactically, the index has tagged its range top (34,280) — detailed previously — an area defining its next technical test.
Last week’s close (34,302) and Tuesday’s session high (34,270) roughly matched resistance. (Thursday’s session high (34,292) also registered nearby.)
The pending selling pressure near the range top, or lack thereof, is worth tracking.
More broadly, recall the developing cup-and-handle defined by the October and December lows.
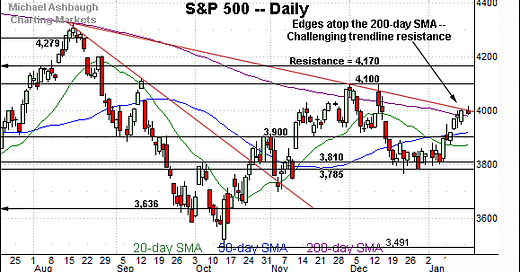
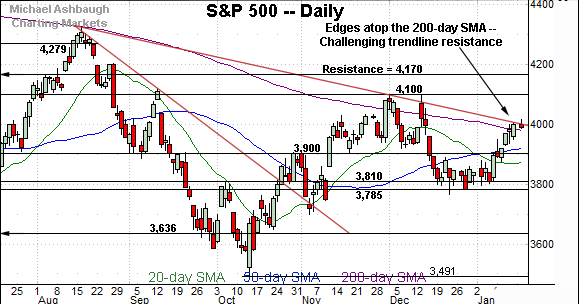
Meanwhile, the S&P 500 has reached a truly headline technical test.
Specifically, the index is challenging trendline resistance, a level roughly tracking the 200-day moving average, currently 3,975.
Last week’s close (3,999) closely matched the trendline amid an extended retest.
Broadening slightly, recall the December whipsaws near the 200-day. The S&P 500 has not registered more than three consecutive closes atop the 200-day moving average since March.
The bigger picture
As detailed above, the U.S. benchmarks’ January rally attempt has reached notable hurdles in recent sessions.
On a headline basis, the S&P 500 has nailed trendline resistance — the 4,000 area — while the Dow Jones Industrial Average has tagged its range top (34,280). (See the daily charts.)
Against this backdrop, the Nasdaq Composite has balked at major resistance (11,220) early Wednesday.
Each benchmarks response to resistance will likely add color.
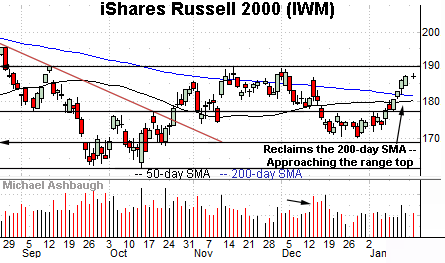
Moving to the small-caps, the iShares Russell 2000 ETF (IWM) has extended its rally attempt, placing distance atop the 50- and 200-day moving averages.
On further strength, the prevailing range top — the 189.55-to-189.90 area — marks a headline technical test.
Follow-through atop this area would punctuate a double bottom — defined by the October and December lows — opening the path to a potentially decisive breakout. (As detailed repeatedly, the Russell 2000 has struggled to place material distance atop the 200-day moving average since November 2021.)
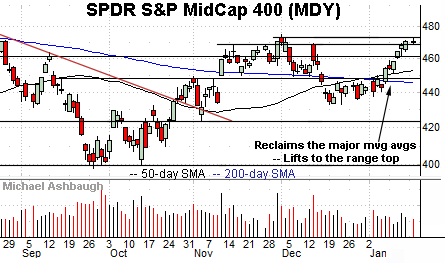
Meanwhile, the SPDR S&P MidCap 400 ETF (MDY) remains incrementally stronger.
In fact, the MDY concluded last week with its best close since August. (Though very narrowly, by just a fraction.)
Against this backdrop, an extended test of the range top — the 475.15 area — remains underway. (See the Dec. peak (475.17) and Aug. gap (475.15).)
Tactically, follow-through higher would punctuate a cup-and-handle defined by the September and December lows.
More broadly, the small- and mid-caps have rallied amid lackluster January volume, reducing the chances of an eventual breakout. At least based on today’s backdrop.
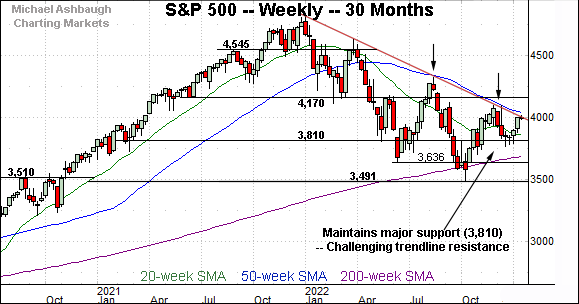
Returning to the S&P 500, this next chart is a weekly view spanning 30 months. Each bar on the chart represents one week.
As illustrated, the S&P 500 continues to challenge trendline resistance, a level hinged to the S&P’s all-time high, established Jan. 4, 2022.
Recall the prevailing upturn marks the first trendline test to originate from a “higher low” versus the prior low.
Slightly more broadly, the prevailing backdrop presents a bull-bear clash between trendline resistance and major support (3,810). The pending break in either direction may be consequential.
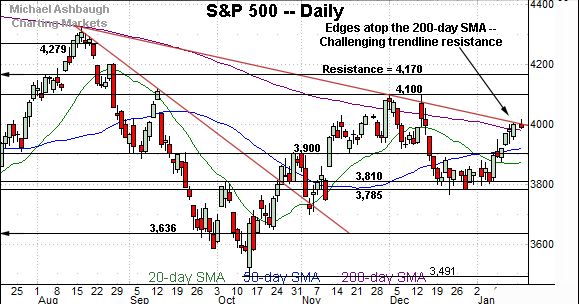
Narrowing to the six-month view adds perspective.
To reiterate, the S&P 500’s trendline roughly tracks the 200-day moving average, currently 3,975.
So broadly speaking, the 3,975-to-4,000 area — detailed last week — marks a headline inflection point.
Against this backdrop, last week’s close (3,999) matched resistance amid an extended retest.
Tactically, sustained follow-through atop the 4,000 area would raise the flag to a potential longer-term trend shift.
Conversely, the 3,900 mark — an area roughly matching the 50-day moving average, currently 3,923 — remains a notable floor. The S&P 500’s rally attempt is intact barring a violation.
Beyond specific levels, it’s worth noting that the S&P 500’s recent rally attempts broadly get low marks for style. For instance, see the aggressive downdraft from the August peak, followed by the comparably flattish rally to the trendline at the December peak. This is followed by another aggressive mid-December downturn, and comparably muted January rally attempt. At least thus far.
Nonetheless, the pending trendline test remains underway, and will likely add color. No new setups today.
Editor’s Note: The next review will be published Tuesday, Jan. 24.

