Charting a (slight) trendline breakout, S&P 500 rises amid market rotation
Focus: Traditional sector leaders concurrently challenge MAJOR resistance, TRAN, XLF, QQQ
Technically speaking, the major U.S. benchmarks have diverged in recent sessions, vacillating against a backdrop that is not one-size-fits-all.
In the process, the S&P 500 has ventured atop trendline resistance, tagging one-month highs amid rotational price action. The breakout’s sustainability and follow-through remain open questions.
Editor’s Note: As always, updates can be directly accessed at https://chartingmarkets.substack.com.
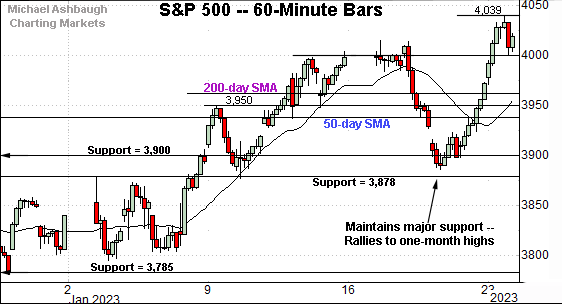
Before detailing the U.S. markets’ wider view, the S&P 500’s hourly chart highlights the past four weeks.
As illustrated, the S&P has broken out, rising to close atop the 4,000 mark for the first time since Dec. 2.
The prevailing upturn punctuates a second successful test of the breakout point (3,878), an area detailed previously. Last week’s low (3,885) registered slightly above major support.
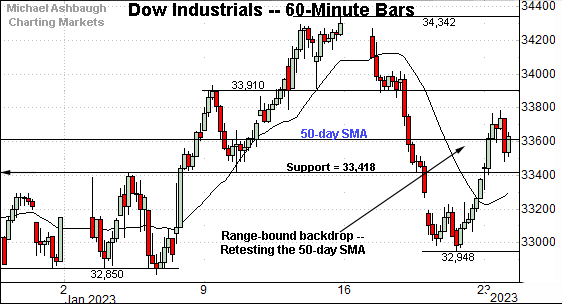
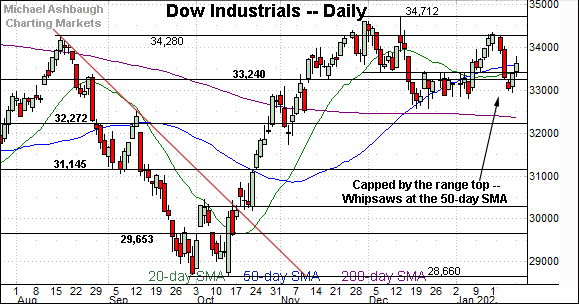
Meanwhile, the Dow Jones Industrial Average has diverged in recent sessions.
More directly, the blue-chip benchmark has not broken out, lagging behind the other major benchmarks.
Instead, the index has whipsawed of late around the 50-day moving average, currently 33,615.
Market bulls will point to a rotational backdrop, as the Dow cools off following an extended period of relative outperformance.
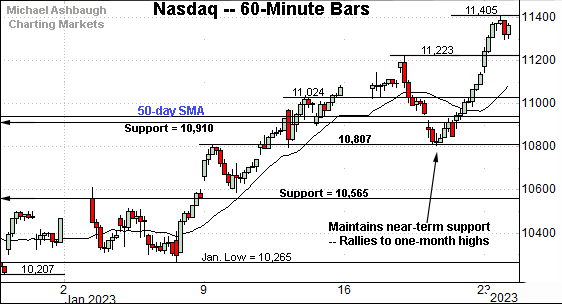
Against this backdrop, the Nasdaq Composite has tagged one-month highs.
The prevailing upturn originates from near-term support (10,807) detailed previously. Last week’s low (10,804) registered nearby.
Combined, the very recent price action signals a rotation back toward growth (Nasdaq tech stocks) and away from value (Dow industrials). The sustainability of this rotation remains an open question.
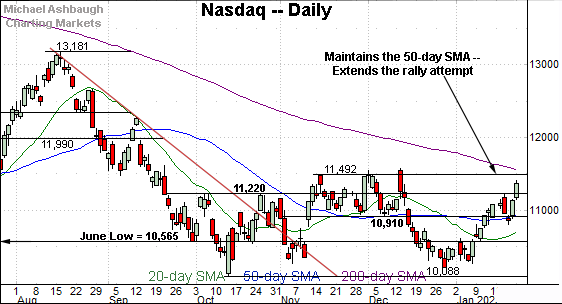
Widening the view to six months adds perspective.
On this wider view, the Nasdaq has extended its January rally attempt.
Recent follow-through places major resistance — broadly spanning from 11,492 to 11,571 — within view.
Against this backdrop, the descending 200-day moving average, currently 11,540, effectively matches the range top. Eventual follow-through atop this area would raise the flag to a primary trend shift.
Conversely, the 11,220 area pivots to support. Last week’s high (11,223) registered nearby.
Delving deeper, the 50-day moving average, currently 10,944, has marked an inflection point. A sustained posture higher signals a bullish intermediate-term bias.
Looking elsewhere, the Dow Jones Industrial Average has diverged from the Nasdaq Composite in recent sessions.
Recall the Dow is not tagging one-month highs along with the Nasdaq.
Nonetheless, the blue-chip benchmark remains the best positioned index in the broader sweep.
Its recent downturn from the range top (34,280) has been punctuated by a “higher low” as the index whipsaws near the 50-day moving average. Also recall the developing cup-and-handle defined by the October and December lows.
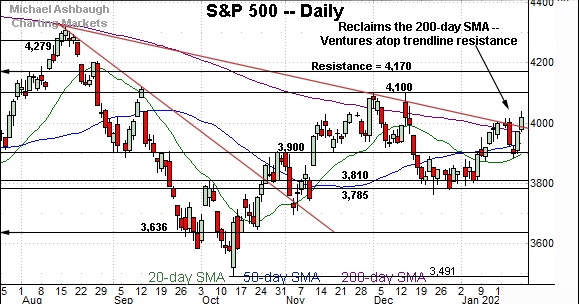
Meanwhile, the S&P 500 has staged a thus far modest trendline breakout.
In the process, the index has also placed distance atop the 200-day moving average, currently 3,964. (Recall the early-December whipsaws at the 200-day moving average, capped by trendline resistance.)
The prevailing upturn originates from major support (3,900), a bull-bear fulcrum, detailed repeatedly. Last week’s closing low (3,899) registered nearby. (See the Jan. 18 review.)
The bigger picture
As detailed above, the major U.S. benchmarks have diverged in recent sessions amid a backdrop that is not one-size-fits-all.
In the process, the S&P 500 has ventured atop trendline resistance, rising amid a rotation back toward growth (Nasdaq tech stocks) and away from value (Dow industrials).
Time will tell whether this rotational price action has legs in the face of still largely hawkish central bank actions.
Moving to the small-caps, the iShares Russell 2000 ETF (IWM) is approaching its range top.
As detailed previously, the 189.55-to-189.90 area marks major resistance.
The prevailing upturn punctuates a tight seven-session range, underpinned by the 50- and 200-day moving averages. Tactically, a breakout attempt is in play barring a violation of the 180.75 area.
(Also notice the pending golden cross — or bullish 50-day/200-day moving average crossover — an event that will likely signal mid-week.)
Similarly, the SPDR S&P MidCap 400 ETF (MDY) is pressing its range top, rising to narrowly register its best close since August.
Against this backdrop, an extended test of major resistance — the 475.15 area — remains underway. (See the Dec. peak (475.17) and Aug. gap (475.15).)
Recall follow-through above resistance would punctuate a cup-and-handle defined by the September and December lows.
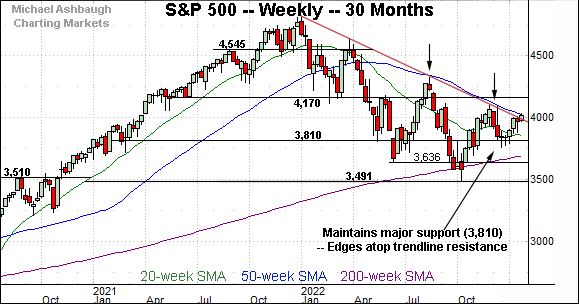
Returning to the S&P 500, this next chart is a weekly view spanning 30 months. Each bar on the chart represents one week.
As illustrated, the S&P 500 has edged atop trendline resistance, a level hinged to the S&P’s all-time high, established Jan. 4, 2022.
Recall the prevailing upturn marks the first trendline test to originate from a “higher low” versus the prior low.
Against this backdrop, the slight breakout thus far gets low marks for style. This is a widely-tracked trendline, and more decisive follow-through would be expected for the prevailing move to signal a cornerstone trend shift.
Returning to the six-month view adds perspective.
Here again, the S&P 500 has ventured atop well defined trendline resistance. Monday’s close (4,020) placed the index 20 points above the 4,000 mark to punctuate 0.5% technical breakout.
This notable because a 0.5% breakout marks the lower bound of the point at which a valid breakout would be considered.
Put differently, the S&P 500 has satisfied what might be considered the bare minimum standard as it applies to the breakout’s magnitude. Against the current market backdrop, more than the bare minimum would be expected before a green light signals for market bulls.
Nonetheless, the breakout attempt remains underway, and has an opportunity to follow-through. The next several sessions will likely add color.
Separately, the breakout’s magnitude applies predominantly to price action, while other variables — including volume, breadth and sector participation — are also always in play.
By this measure, the recent volume and breadth stats have serious “room for improvement,” while several important sector tests are detailed in the next section.
Against this backdrop, the 3,900 mark remains a bull-bear fulcrum, as detailed repeatedly. Last week’s closing low (3,899) effectively matched major support to punctuate a successful retest. The S&P 500’s rally attempt is intact barring a violation of this area.
(On a granular note, the S&P 500 has not registered more than three consecutive closes atop the 200-day moving average since March. The index is vying Tuesday to notch its third straight close atop the 200-day moving average.)
Watch List — Sector leaders reach key technical tests
Drilling down further, influential sectors have reached potentially important technical tests. Three groups exemplify the backdrop:
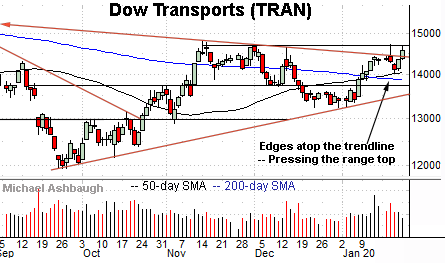
To start, the Dow Transports (TRAN) is showing signs of life technically.
As illustrated, the group has edged atop trendline resistance, rising to challenge a nearly five-month range top. (Monday’s close marked the second-best close since August.)
The prevailing upturn punctuates a relatively tight one-week range, underpinned by the 50-day moving average.
Tactically, a rally above the range top — the 14,690 area — would mark a material “higher high” confirming the group’s recent trend shift.
Conversely, the 50- and 200-day moving averages pivot to support. Notice the recent golden cross, or bullish 50-day/200-day moving average crossover. The group’s breakout attempt is in play barring a violation of this area. (Also see the Jan 10 review.)
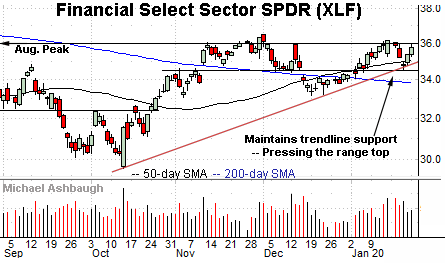
Meanwhile, the Financial Select Sector SPDR (XLF) has reached a major technical test.
Specifically, the group is pressing a nine-month range top defined by resistance broadly spanning from about 36.00 to 36.50. (See the Aug. peak (35.97), the Nov. closing peak (36.31) and the Dec. peak (36.49).)
The prevailing upturn originates from trendline support. Tactically, a breakout attempt is in play barring a violation of the 34.55 area.
More broadly, the prevailing upturn punctuates a massive double bottom — defined by the July and October lows — as illustrated below. A break from the range top opens the path to potentially material upside follow-through.
Finally, the Invesco QQQ Trust (QQQ) tracks the Nasdaq 100 Index and is a large-cap technology sector proxy.
As illustrated, the QQQ is challenging trendline resistance, an area closely followed by the 200-day moving average, currently 293.34. (Also see the Dec. peak (296.88).)
Here again, the upturn punctuates a double bottom defined by the October and December lows. Tactically, the 275-to-278 area marks notable support. A breakout attempt is in play barring a violation.
Summing up the sub-sector backdrop
Combined, the traditional sector leaders — the transports, financials and technology sector — have reached potentially consequential technical tests. The pending response to resistance, detailed above, should be a useful bull-bear gauge.


