Charting a bull-bear battle, S&P 500 nails 200-day average
Focus: Natural gas challenges key resistance, Utilities tag all-time highs, Energy sector's breakout attempt, UNG, XLU, XLE, WMT, CMR, CHPT
Technically speaking, the U.S. benchmarks’ summer uptrend is intact, though the rally attempt has reached a seriously major technical test.
Specifically, the S&P 500 has tagged its marquee 200-day moving average — almost precisely — a widely-tracked longer-term trending indicator. The pending selling pressure in this area, or lack thereof, should be a useful bull-bear gauge.
Editor’s Note: As always, updates can be directly accessed at https://chartingmarkets.substack.com.
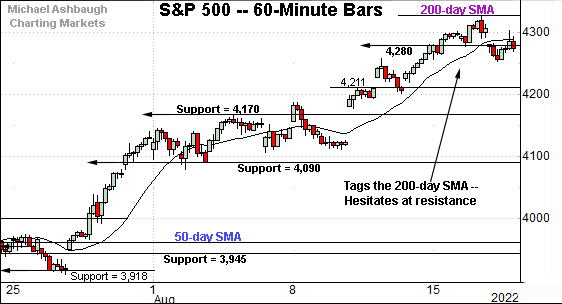
Before detailing the U.S. markets’ wider view, the S&P 500’s hourly chart highlights the past four weeks.
As illustrated, the S&P has rallied to a headline technical test, rising to tag the 200-day moving average, currently 4,323.
The week-to-date peak (4,325) has registered nearby.
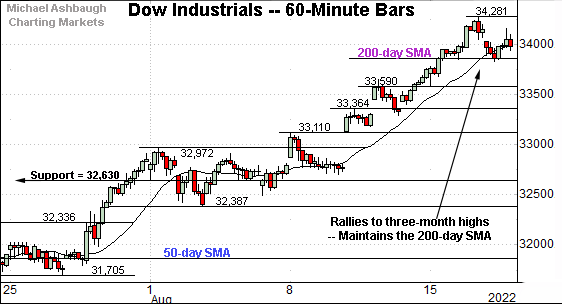
Meanwhile, the Dow Jones Industrial Average has sustained a slightly more aggressive August breakout.
The prevailing upturn has been punctuated by consecutive closes atop the 200-day moving average, currently 33,870. This area is also detailed on the daily chart.
As always, the 200-day moving average is a widely-tracked longer-term trending indicator.
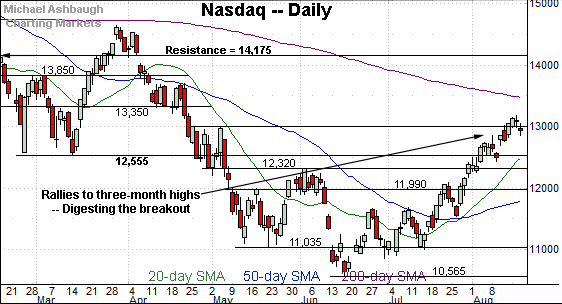
Against this backdrop, the Nasdaq Composite is also digesting an August breakout.
The initial pullback has been shallow, and underpinned by first support (12,855) detailed previously.
The week-to-date low (12,863) has registered nearby.
Widening the view to six months adds perspective.
On this wider view, the Nasdaq has knifed to nearly four-month highs, its best level since April 22.
Moreover, the initial pullback from the August peak has been flattish, and underpinned by near-term support. (See the hourly chart.)
Tactically, the marquee 200-day moving average, currently 13,460, is descending within view. Conversely, the prevailing upturn originates from a successful test of the 50-day moving average at the late-July low.
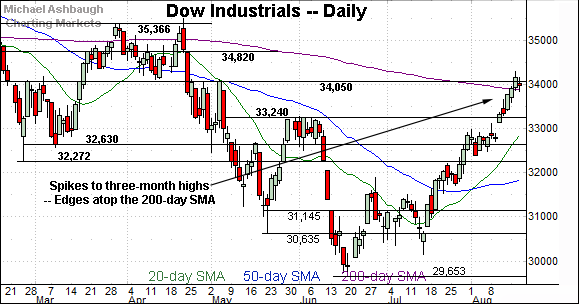
Looking elsewhere, the Dow Jones Industrial Average has also tagged nearly four-month highs.
In the process, the index has registered consecutive closes atop its 200-day moving average, currently 33,870.
To reiterate, sustained follow-through atop the 200-day would raise the flag to a primary trend shift.
Delving deeper, the mid-August breakout point (33,240) marks a bull-bear fulcrum.
Meanwhile, the S&P 500 has reached the U.S. benchmarks’ headline technical test.
Specifically, the index has tagged its 200-day moving average, currently 4,323.
To reiterate, the week-to-date peak (4,325) has closely matched the 200-day. The response to this area — across potentially the next several sessions — should be a useful bull-bear gauge.
The bigger picture
As detailed above, the major U.S. benchmarks’ continue to trend higher.
In the process, the S&P 500 has tagged its 200-day moving average — and initially drawn muted selling pressure — while the Dow Jones Industrial Average has sustained a slight break atop its 200-day moving average.
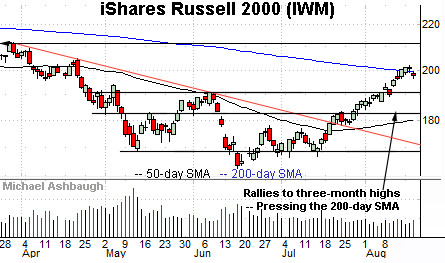
Moving to the small-caps, the iShares Russell 2000 ETF (IWM) is consolidating its August breakout.
The small-cap benchmark has thus far held tightly to its 200-day moving average, currently 199.20.
The prevailing one-week flag-like pattern — the tight range, hinged to the 200-day — is technically constructive.
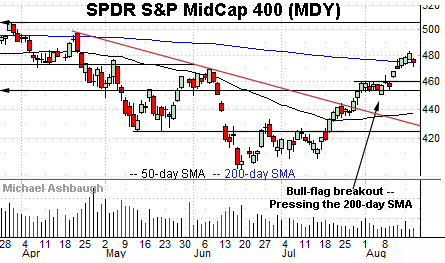
Similarly, the SPDR S&P MidCap 400 ETF (MDY) has asserted a mid-month flag pattern.
Here again, the mid-cap benchmark is hugging its 200-day moving average, currently 474.20, notching four straight closes slightly atop the trending indicator.
Slightly more broadly, recall the prevailing upturn punctuates an early-August flag pattern. Constructive price action.
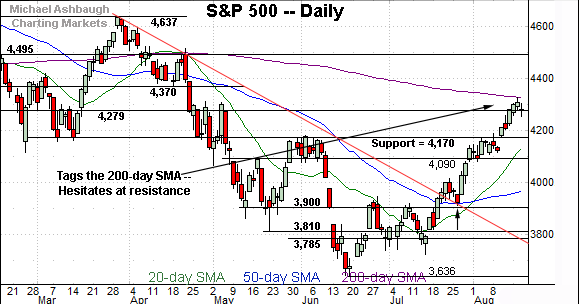
Returning to the S&P 500, the chart above highlights the U.S. markets’ headline technical test.
To reiterate, the S&P has tagged its 200-day moving average, currently 4,323, a level generally defining the primary (longer-term) trend.
The index has initially drawn muted selling pressure near the 200-day — which is constructive — though the retest remains underway. As always, the chances of upside follow-through improve to the extent an index holds relatively tightly to major resistance.
Tactically, the breakout point (4,170) marks major support and is followed by the 4,090 floor. (The August closing low (4,091) matched support.)
Against this backdrop, the S&P 500 remains near-term extended — and a sideways consolidation phase seems to be underway — though the prevailing rally attempt is intact barring a violation of the 4,090 area. As always, it’s not just what the markets do, it’s how they do it.
Also see the July 21 review: Charting a (potential) bullish trend shift, S&P 500 stages trendline breakout.
Also see the Aug. 11 review: Charting a bullish technical tilt, S&P 500 clears major resistance amid 10-to-1 up day.
Watch List
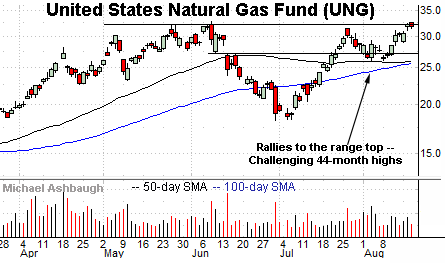
Drilling down further, the United States Natural Gas Fund (UNG) is rattling the cage on a breakout. The fund tracks natural gas futures contracts.
Technically, the shares are rising from a modified head-and-shoulders bottom defined by the May, June and August lows. A near-term target projects to the 37.00 area on follow-through.
Conversely, the August pullback has been underpinned by the 50-day moving average, currently 25.80. A breakout attempt is in play barring a violation of this area.
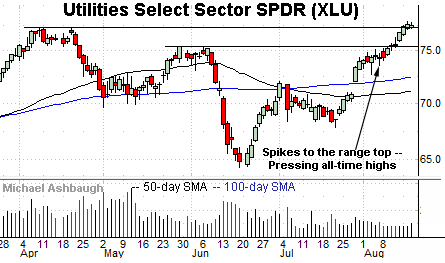
Moving to U.S. sectors, the Utilities Select Sector SPDR (XLU) has edged to all-time highs. (Yield = 2.8%.)
The prevailing upturn builds on a late-July gap atop the 100-day moving average.
Tactically, the early-August breakout point (75.40) pivots to support. A sustained posture atop this area signals a firmly-bullish bias.
Meanwhile, the Energy Select Sector SPDR (XLE) is showing signs of life technically.
Earlier this month, the shares rallied atop trendline resistance, rising to challenge two-month highs.
Recent persistence near the range top signals muted selling pressure, laying the groundwork for a potential breakout. A near-term target projects to the 82.00 area.
Tactically, the 50-day moving average, currently 75.04, is closely followed by trendline support. A breakout attempt is in play barring a violation.
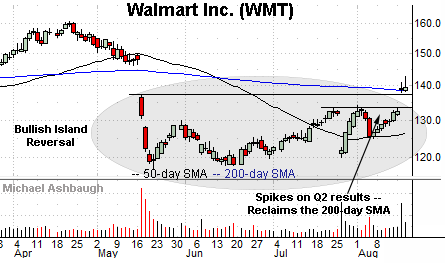
Moving to specific names, Walmart Inc. (WMT) is a Dow 30 component coming to life.
Earlier this week, the shares gapped sharply higher, rising after the company’s second-quarter results. The strong-volume spike places the shares atop the marquee 200-day moving average, currently 138.64.
More broadly, the breakout punctuates a bullish island reversal defined by the May and August gaps. As always, the island reversal is a high-reliability reversal pattern. (The pattern’s reliability strengthens with its duration, and the gaps’ size, both of which are large in the present case.)
Tactically, gap support (138.20) is followed by the firmer breakout point (133.50). A sustained posture higher signals a bullish bias.
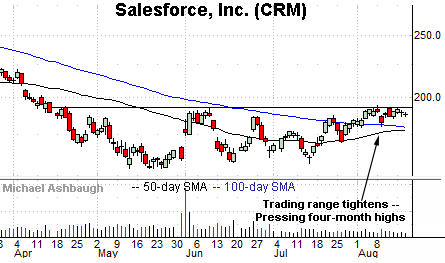
Looking elsewhere, Salesforce, Inc. (CRM) is a well positioned large-cap software vendor.
Technically, the shares have rallied to the range top, rising to challenge four-month highs.
The tight August range signals muted selling presure near resistance, laying the groundwork for potentially decisive upside follow-through. Tactically, the breakout attempt is intact barring a violation of support in the 179.50 area.
Note the company’s quarterly results are due out Aug. 24.
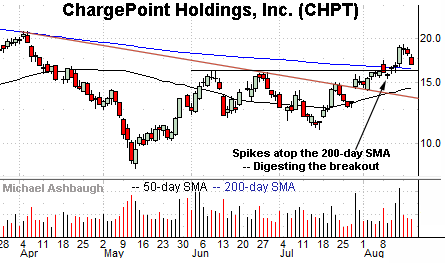
Finally, ChargePoint Holdings, Inc. (CHPT) is a large-cap developer of electric vehicle (EV) charging solutions.
As illustrated, the shares have knifed atop the 200-day moving average, rising after U.S. legislation passed subsidizing clean-energy development.
The subsequent pullback has been fueled by decreased volume, placing the shares 14.8% under the August peak.
Tactically, the 200-day moving average, currently 16.35, is closely followed by the breakout point (16.15). The prevailing rally attempt is intact barring a violation.


