Charting a bearish reversal, S&P 500 sells off from 200-day average
Focus: 10-year Treasury yield clears key trendline ahead of Federal Reserve's policy guidance
Technically speaking, the U.S. benchmarks have reversed respectably from the August peak, pressured in the wake of a headline technical test.
Specifically, the S&P 500 has stalled at its 200-day moving average — a widely-tracked longer-term trending indicator — and the subsequent downdraft has inflicted technical damage. The pending downside follow-through from current levels, or lack thereof, may add color.
Editor’s Note: As always, updates can be directly accessed at https://chartingmarkets.substack.com.
Before detailing the U.S. markets’ wider view, the S&P 500’s hourly chart highlights the past four weeks.
As illustrated, the S&P has pulled in respectably from its 200-day moving average, currently 4,315. The prevailing downturn punctuates a failed test from underneath.
More immediately, the S&P has violated major support (4,170) an area better illustrated on the daily chart. The swift violation — on the first retest — is less than ideal.
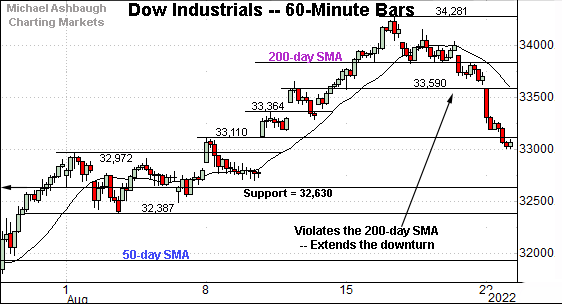
Meanwhile, the Dow Jones Industrial Average has violated its 200-day moving average, currently 33,827.
The prevailing downturn punctuates a brief three-session stint atop the longer-term trending indicator.
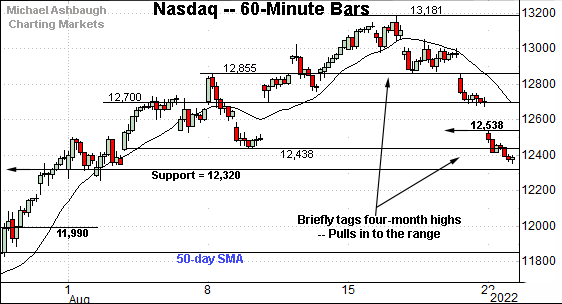
Against this backdrop, the Nasdaq Composite has also reversed sharply from the August peak.
The prevailing downturn places the index back under first support (12,855) detailed previously. Friday’s session high (12,859) registered nearby.
More broadly, the Nasdaq has also violated more significant support, an area better illustrated below.
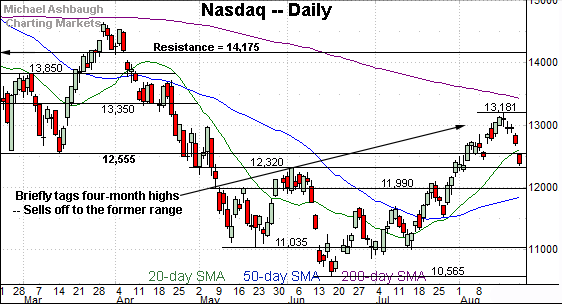
Widening the view to six months adds perspective.
On this wider view, the Nasdaq has reversed sharply from four-month highs.
In the process, the index has dropped as much as 800 points, or 6.1%, across just five sessions. (The Nasdaq has dropped about 4.5% over the prior two sessions.)
Tactically, the index has violated its former breakdown point (12,555). This area “should” have drawn buyers on the first retest if a firmly-grounded uptrend were in play.
So the immediate violation of the 12,555 area — on the first approach — raises at least a technical question mark, if not an outright caution flag. On further weakness, the 12,320 area marks deeper support.
More broadly, the Nasdaq is the only major U.S. benchmark not to reach its 200-day moving average at the August peak.
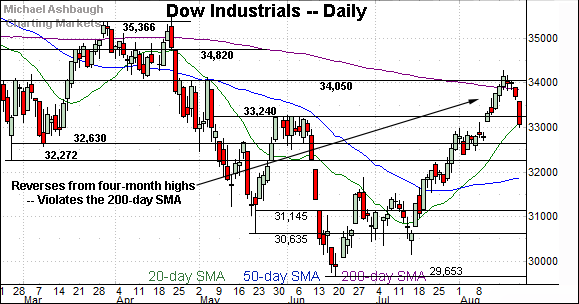
Looking elsewhere, the Dow Jones Industrial Average has also reversed from four-month highs.
But in the Dow’s case, the prevailing downturn punctuates a false break atop the 200-day moving average. The index registered three straight closes slightly atop the 200-day before selling off aggressively.
Amid the downturn, the index has violated major support — the mid-August breakout point (33,240), detailed previously — on the the first approach.
Meanwhile, the S&P 500 has staged the U.S. benchmarks’ headline technical test.
Specifically, the index has reversed sharply from its 200-day moving average, a widely-tracked longer-term trending indicator. The August peak registered less than one point lower, and selling pressure has indeed surfaced.
The failed test of this area has likely contributed to a relatively broadly-based subsequent downdraft, also pressuring other market pockets.
The bigger picture
As detailed above, the U.S. benchmarks have reversed respectably from the August peak, pressured at least partly in the wake of Friday’s options expiration.
The subsequent repositioning, across asset classes, has inflicted technical damage in spots.
On a headline basis, each big three U.S. benchmark has violated major support — S&P 4,170, Nasdaq 12,555 and Dow 33,240 — areas that “should” have drawn buyers on the first approach. At least if a durable uptrend were in play.
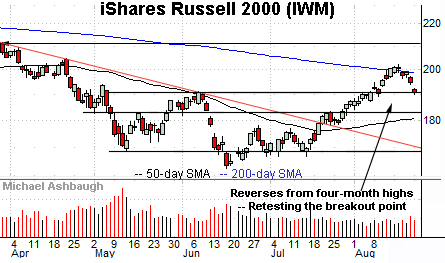
Moving to the small-caps, the iShares Russell 2000 ETF (IWM) has reversed from four-month highs.
In the process, the small-cap benchmark has violated its 200-day moving average, currently 198.80, pressured amid a volume uptick.
Tactically, an extended retest of the breakout point (190.90) — an area detailed previously — remains underway. Tuesday’s early session low (190.89) has registered nearby.
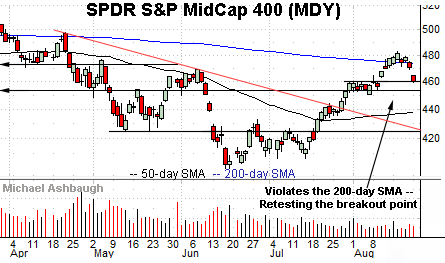
Similarly, the SPDR S&P MidCap 400 ETF (MDY) has pulled in respectably from four-month highs.
The prevailing downturn places it comfortably back under the 200-day moving average, currently 473.30.
Here again, a retest of the breakout point (460.00) remains underway.
Combined, the small- and mid-cap benchmarks have registered jagged, and thus far failed, tests of the 200-day moving average from underneath. The downdrafts from this area raise a technical question mark.
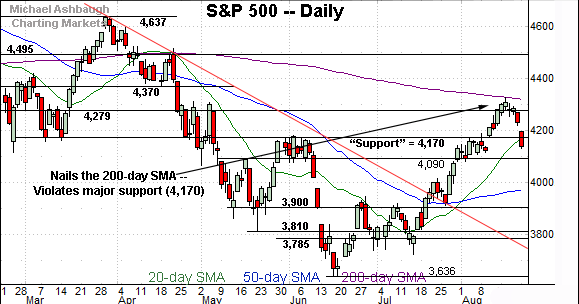
Returning to the S&P 500, the chart above highlights potentially consequential price action.
On a headline basis, the S&P 500 has stalled precisely at its 200-day moving average, and turned firmly lower, pressured amid a respectable downdraft. (Just a 5-to-1 down day, but still a directionally sharp pullback.)
Moreover, the index has knifed straight through the 4,170 support, a well-defined bull-bear inflection point. To reiterate, the immediate violation of this area — on the first approach — raises at least a technical question mark, if not an outright caution flag.
So to the extent the 200-day moving average defines the longer-term trend — which it does — the prevailing backdrop continues to signal a primary downtrend. This is the prevailing backdrop’s most straightforward, and likely most important, takeaway.
The less straightforward issue is gauging the summer rally’s status, also known as the intermediate-term recovery attempt.
The framework here — detailed repeatedly — has been to lean on the 4,090 support, a level the August closing low (4,091) matched. (Note the 4,090 support is not defined by the August closing low.)
With the benefit of the prior two sessions — in the wake of Friday’s options expiration — an alternate view would be to tag the 4,090-to-4,170 area as an intermediate-term caution zone. A swift reversal back atop S&P 4,170 places the recovery attempt on firmer footing, while a violation of the 4,090 area could vaporize the recovery attempt.
The response to the Federal Reserve’s pending policy guidance, due out later this week, will likely add color.
Watch List
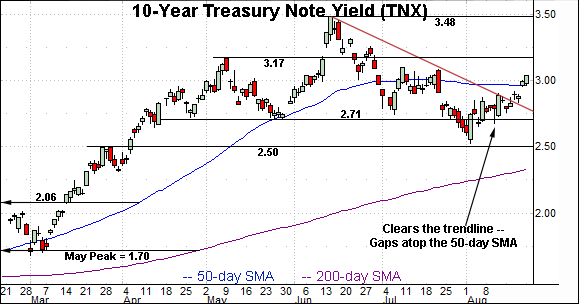
Concluding on a stray note, the 10-year Treasury note yield (TNX) has come to life technically.
In the process, the yield has cleared a two-month trendline, and gapped atop the 50-day moving average, currently 2.96.
Tactically, the yield’s intermediate-term bias is neutral-to-higher. The top of the gap (2.95) closely matches the 50-day moving average and marks an inflection point.
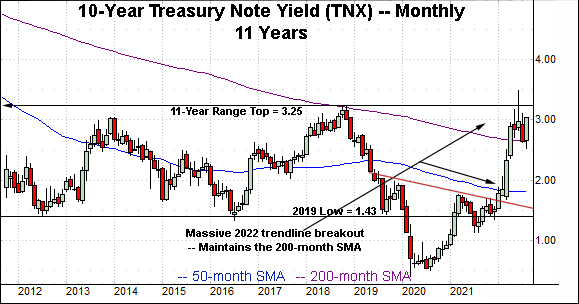
More broadly, the yield’s longer-term path of least resistance remains higher. The prevailing upturn punctuates a four-month consolidation phase, also detailed on the monthly chart.
On a granular note, consider that the 200-month moving average — detailed on the monthly chart — has marked an inflection point, effectively defining the 2018 peak, and underpinning the prevailing four-month range. (The July monthly close registered just one basis point above the 200-month moving average.)
Also recall that eventual follow-through above the 11-year range top (3.25) opens the path to a less-charted patch, and a potentially swift spike, possibly rivaling the early-2022 trendline breakout. The pending retest of this area is a “watch out.”
Separately, the U.S. dollar has strengthened versus the euro, amid surging yields, placing the euro below parity with the U.S. dollar for the first time in 20 years.


