Summer rally attempt pauses as S&P 500 approaches major resistance (4,170)
Focus: 10-year Treasury note yield presses four-month lows amid head-and-shoulders top, Small- and mid-caps extend trendline breakouts
Technically speaking, the major U.S. benchmarks have extended a summer rally attempt, rising amid improved market breadth and sector participation.
Against this backdrop, the S&P 500 has tagged seven-week highs, rising within striking distance of a genuinely significant technical test (4,170).
Editor’s Note: As always, updates can be directly accessed at https://chartingmarkets.substack.com.
Before detailing the U.S. markets’ wider view, the S&P 500’s hourly chart highlights the past four weeks.
As illustrated, the S&P has tagged seven-week highs.
The breakout punctuates a flag-like pattern — the tight-one-week range — underpinned by major support in the 3,900-to-3,920 area, detailed previously.
From current levels, the 4,090 area marks first support, also detailed on the daily chart.
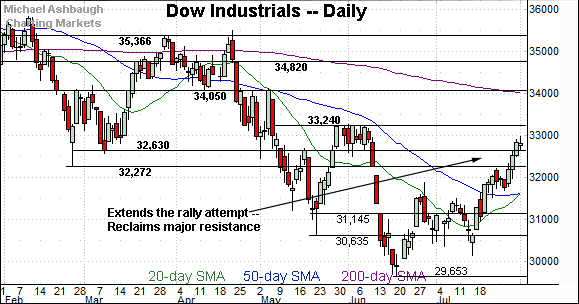
Similarly, the Dow Jones Industrial Average has rallied to seven-week highs.
Here again, recent follow-through punctuates a bull-flag breakout.
Tactically, the 32,630 area marks an inflection point, also detailed on the daily chart.
Delving deeper, the 50-day moving average, currently 31,650, is followed by the firmer breakout point (31,510). A sustained posture atop this area signals a bullish-leaning intermediate-term bias.
Against this backdrop, the Nasdaq Composite has tagged nearly three-month highs, its best level since May 5.
Like the S&P 500, the Nasdaq’s breakout originates from major support (11,560), detailed previously.
From current levels, the 12,320 area marks an inflection point, also detailed on the daily chart below.
Widening the view to six months adds perspective.
On this wider view, the Nasdaq has extended its rally attempt, knifing to nearly three-month highs.
To reiterate, a sustained posture atop the breakout point (11,677) and the 50-day moving average (11,570) signals a bullish-leaning intermediate-term bias.
Looking elsewhere, the Dow Jones Industrial Average has also sustained a July breakout.
Tactically, the 31,510-to-31,650 area marks support, levels matching the breakout point and the 50-day moving average. (Also see the hourly chart.)
More broadly, this is the only major benchmark to reclaim the March closing low (32,630). This area corresponds with major resistance at S&P 4,170, a headline bull-bear battleground.
More plainly, the Dow industrials have strengthened slightly versus the other major benchmarks.
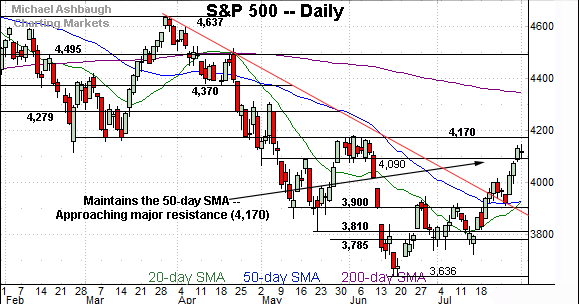
Meanwhile, the S&P 500 has extended its trendline breakout.
Recall the prevailing upturn punctuates a successful test of the 50-day moving average, currently 3,930.
The Nasdaq Composite has staged a similar spike from its 50-day moving average.
The bigger picture
As detailed above, the major U.S. benchmarks are acting well technically.
On a headline basis, each big three benchmark has extended its rally attempt, rising to tag at least seven-week highs.
Amid the upturn, each index has reclaimed several overhead inflection points, and subsequently observed former resistance as support. The S&P 3,920 and Nasdaq 11,560 areas stand out as bullish examples. (See the hourly charts.)
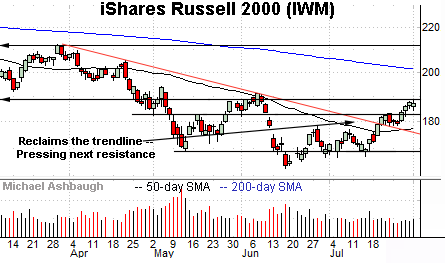
Moving to the small-caps, the iShares Russell 2000 ETF (IWM) has also extended its rally attempt.
In the process, the prevailing upturn has precisely tagged next resistance. (The August peak (188.32) has matched the February open/close low (188.32).)
Tactically, initial support (182.50) is followed by the 50-day moving average, currently 177.46, and the mid-July breakout point (177.00). A sustained posture atop this area signals a bullish intermediate-term bias.
Similarly, the SPDR S&P MidCap 400 ETF (MDY) has extended its trendline breakout.
Notably, the prevailing upturn places the MDY atop its corresponding resistance (453.40).
So the mid-cap benchmark has strengthened modestly versus the small-caps, also rising amid slightly increased volume.
Returning to the S&P 500, the index has knifed to nearly two-month highs.
The prevailing upturn places major resistance (4,170) — a level matching the May breakdown point — firmly within view.
Recall the aggressive June plunge from resistance (4,170).
Tactically, the 4,170 hurdle is well-defined, and may be the toughest to crack of the levels detailed above. For the near-term, the risk-reward on new long positions in this area is not great.
(On a granular note, the 50% retracement of the downturn from the March peak to the June low rests at 4,137. The August peak (4,145) has registered nearby.)
Conversely, the 3,900-to-3,920 area remains important support. A sustained posture higher signals a bullish-leaning intermediate-term bias, as detailed previously.
Beyond near-term issues, the S&P 500’s longer-term bias remains bearish pending more extensive repairs.
Watch List
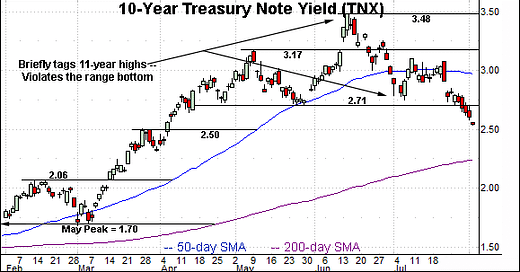
Concluding on a stray note, the 10-year Treasury note yield (TNX) has staged a surprising downturn from 11-year highs.
In the process, the yield has tagged nearly four-month lows, its lowest level since April 6.
Fundamentally, the Federal Reserve’s recent dovish-leaning policy language has contributed to the prevailing pullback. Separately, a flight-to-safety trade — fueled by events in Europe, and more recently Taiwan — may be contributing.
Technically, the prevailing downturn punctuates a head-and-shoulders top defined by the May, June and July peaks. An intermediate-term target projects to the 2.40 area.
Separately, consider that the mid-point of the yield’s 11-year range — illustrated on the monthly chart — holds around 2.34.
Conversely, the former range botttom (2.71) marks an overhead inflection point. A reversal atop this area would signal the prevailing downturn may have run its course.
More broadly, the yield’s longer-term path of least resistance points higher based on today’s backdrop. The recent pullback punctuates a “sideways” cooling-off period hinged to the massive early-2022 trendline breakout, detailed on the monthly chart.


