Charting a bull-bear battle, S&P 500 balks at major resistance (3,900)
Focus: Global market cross currents persist as Europe and Japan press key trendlines, IEV, EWJ, FXI
Technically speaking, the major U.S. benchmarks are off to a sluggish November start amid a bigger-picture backdrop that is not one-size-fits-all.
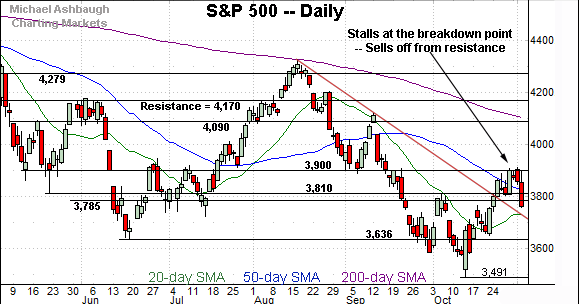
Amid the cross currents, the S&P 500 and Nasdaq Composite have effectively nailed major resistance — S&P 3,900 and Nasdaq 11,220 — areas that have drawn selling pressure after the Federal Reserve’s latest policy statement.
Editor’s Note: As always, updates can be directly accessed at https://chartingmarkets.substack.com.
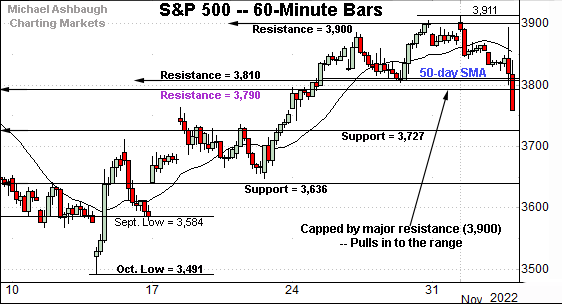
Before detailing the U.S. markets’ wider view, the S&P 500’s hourly chart highlights the past four weeks.
As illustrated, the S&P has thus far balked at major resistance (3,900).
The prevailing downturn places the index back under its 50-day moving average, currently 3,813.
From current levels, the 3,790-to-3,810 area marks notable overhead.
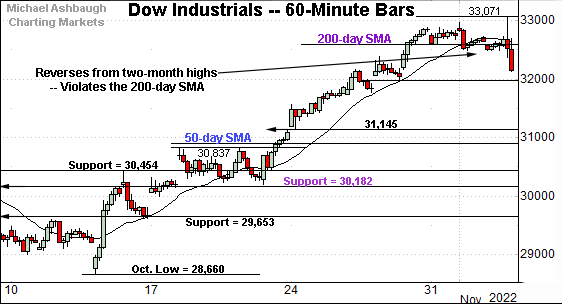
Meanwhile, the Dow Jones Industrial Average remains the strongest major benchmark.
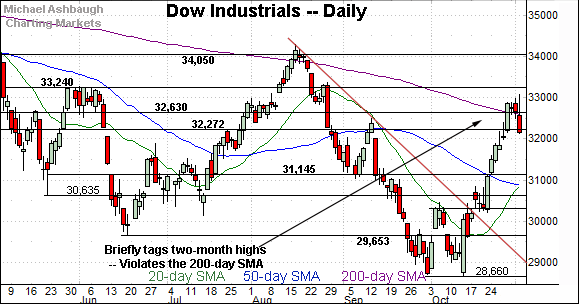
Nonetheless, the index has reversed from two-month highs, re-violating its 200-day moving average, currently 32,580.
Recall this was the only benchmark to even approach its 200-day moving average, as detailed on the daily charts.
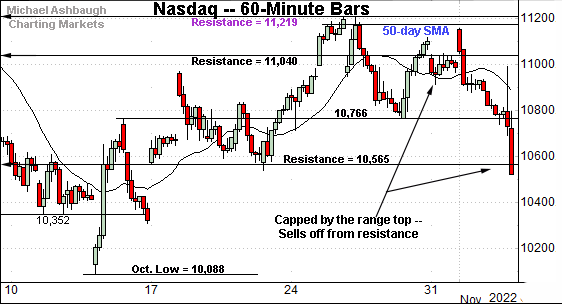
Against this backdrop, the Nasdaq Composite continues to underperform the other benchmarks.
As illustrated, the index has extended a pullback from major resistance (11,219), an area also detailed below.
Notice the range top roughly matches the 50-day moving average.
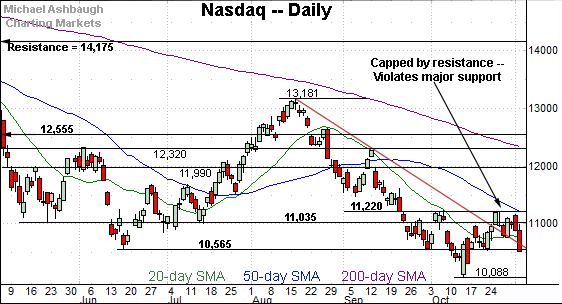
Widening the view to six months adds perspective.
On this wider view, the Nasdaq has struggled to gain traction of late.
The recent rally attempt has stalled near major resistance (11,220), an area detailed repeatedly. (See for instance, the Oct. 20 review.)
More immediately, the index has ventured back under its former breakdown point (10,565), pulling in to the year’s fourth-worst close after the Federal Reserve’s latest policy statement.
Looking elsewhere, the Dow Jones Industrial Average has rallied much more aggressively from the October low.
The recent spike has been punctuated by a brief whipsaw atop the marquee 200-day moving average.
But notably, the Dow has not registered more than four consecutive closes atop the 200-day moving average since February, the hallmark of a primary downtrend.
So tactically, the Dow’s massive trendline breakout — an unusual two standard deviation move — has clashed with the marquee longer-term trending indicator. The pending selling pressure in this area, or lack thereof, will likely add color.
Meanwhile, the S&P 500 is digesting a less aggressive trendline breakout.
The recent rally attempt has stalled near major resistance (3,900) — detailed previously — an area matching the June gap (3,900) and the May closing low (3,900).
More broadly, the S&P 500 and Nasdaq Composite have topped firmly under the 200-day moving average, exhibiting relative weakness versus the Dow industrials.
The bigger picture
As detailed above, the major U.S. benchmarks have diverged in recent weeks as market cross currents persist.
On a headline basis, the S&P 500 and Nasdaq Composite have effectively nailed major resistance — S&P 3,900 and Nasdaq 11,220 — pulling in respectably after the Federal Reserve’s policy statement. (The Nasdaq plunged 366 points, or 3.36%, on the session, while the S&P 500 staged a daily downdraft of 96 points, or 2.5%.)
Meanwhile, the Dow Jones Industrial Average has thus far sustained a decisive trendline breakout, briefly flirting with its 200-day moving average. (The Dow registered a daily loss of 505 points, or 1.54%, after the Fed.)
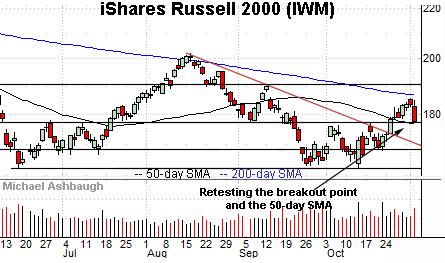
Moving to the small-caps, the iShares Russell 2000 ETF (IWM) has thus far sustained a recent trendline breakout.
Tactically, a retest of the breakout point (177.50) remains underway. The prevailing downturn has been fueled by increased volume.
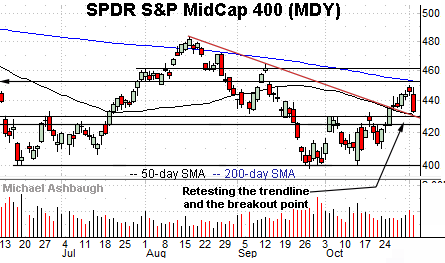
Similarly, the SPDR S&P MidCap 400 ETF (MDY) is digesting a trendline breakout.
In its case, the trendline closely tracks the 50-day moving average, currently 430.10. Delving slightly deeper, the breakout point (429.70) remains notable support.
More broadly, the small- and mid-caps have sustained breaks from a double bottom — the W formation — defined by the September and October lows. Each benchmark has thus far maintained its breakout point, though retests remains underway.
Returning to the S&P 500, the index has balked at major resistance (3,900).
The October closing high (3,901) registered nearby, and selling pressure has surfaced.
Moreover, the downturn places the index back under major support (3,810) an area matching its 50-day moving average, currently 3,813.
Amid the downturn, Wednesday’s Fed-fueled selling pressure approached bearish extremes: NYSE declining volume surpassed advancing volume by a 7-to-1 margin.
So tactically, the S&P 500’s sluggish November start places its recovery attempt in doubt. A swift reversal back atop the 3,810 area would signal the rally attempt may yet have legs.
More broadly, the S&P 500’s bigger-picture backdrop remains bearish pending more extensive repairs.
Editor’s Note: The next review will be published Wednesday, Nov. 9.
Watch List — Charting global market cross currents
Beyond the U.S., influential global markets have also diverged in recent weeks:
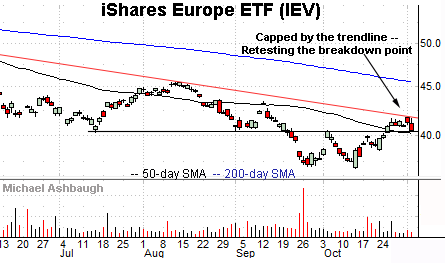
To start, the iShares Europe ETF (IEV) has reached a notable test.
As illustrated, the shares have stalled at trendline resistance, pulling in to retest the former breakdown point (40.25).
The pending response to this area is worth tracking. Sustained follow-through atop the trendline would strengthen the intermediate-term bull case. (Also see the Oct. 13 review.)
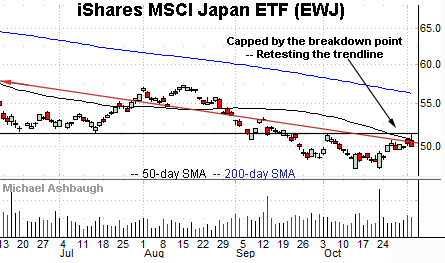
Meanwhile, the iShares MSCI Japan ETF (EWJ) has registered a slightly softer recovery attempt. At least so far.
As illustrated, the shares have stalled near trendline resistance closely matching the 50-day moving average and the breakdown point (51.55). November selling pressure has registered amid increased volume.
Here again, sustained follow-through atop the trendline would strengthen the bull case. (Also see the Oct. 13 review.)
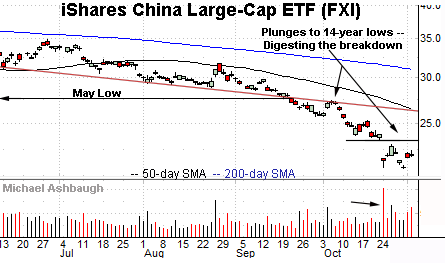
Finally, the iShares China Large-Cap ETF (FXI) is digesting a downdraft to 14-year lows, its worst levels since October 2008.
The prevailing downturn originates from trendline resistance and the breakdown point (27.80). (See the Sept. 22 review.)
From current levels, the 23.00-to-23.40 area marks resistance. Follow-through higher would mark an early step toward stabilization.
More broadly, the 17-year chart below adds perspective. Notice the aggressive 2022 downdraft has been fueled by a sustained volume increase. (Also see the Sept. 22 review for added context.)
Editor’s Note: The next review will be published Wednesday, Nov. 9.


