Charting a bear-market rally, S&P 500 sustains October bounce
Focus: Transports and financials press key trendlines, Energy sectors break out, TRAN, XLF, XLE, OIH
Technically speaking, the major U.S. benchmarks have thus far sustained an October rally attempt.
Amid the upturn, the bigger-picture backdrop is not one-size-fits-all, though each big three benchmark has managed to maintain a posture atop key technical levels. The charts below add color.
Editor’s Note: As always, updates can be directly accessed at https://chartingmarkets.substack.com.
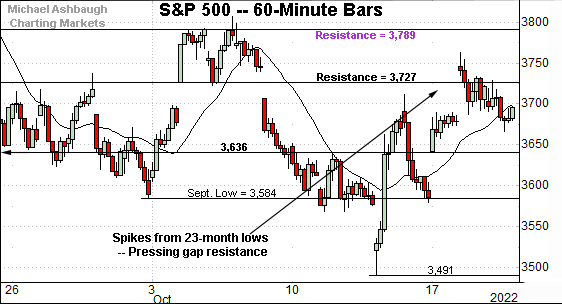
Before detailing the U.S. markets’ wider view, the S&P 500’s hourly chart highlights the past four weeks.
As illustrated, the S&P has knifed from its range bottom.
Tactically, gap resistance (3,727) is followed by the range top (3,790), an area established after the Federal Reserve’s policy statement.
Meanwhile, the Dow Jones Industrial Average remains stronger than the other benchmarks.
As illustrated, the index has tagged nearly one-month highs, its best level since Sept. 21. The prevailing upturn punctuates a double bottom defined by the September and October lows.
Slightly more broadly, the sharp rally off the October low, and flattish subsequent pullbacks, are technically constructive.
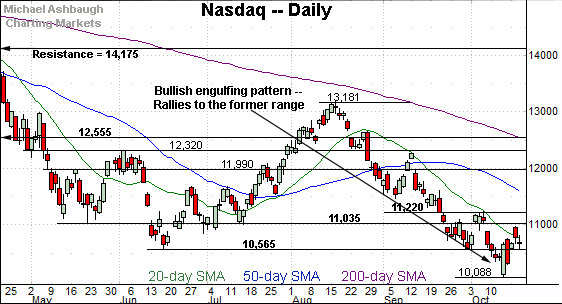
Against this backdrop, the Nasdaq Composite remains the weakest major benchmark.
Still, the index has sustained a rally to its former range.
Recall the prevailing upturn places the Nasdaq atop its breakdown point (10,565), an area also detailed below. The week-to-date low (10,569) has matched support.
(Also recall Nasdaq 10,565 corresponds with S&P 3,636 as illustrated on the daily charts below.)
Widening the view to six months adds perspective.
On this wider view, the Nasdaq has sustained a reversal from 27-month lows. The initial pullback has been underpinned by the former breakdown point (10,565).
From current levels, the 20-day moving average, currently 10,750, is followed by resistance in the 11,035-to-11,040 area. (Also see the hourly chart.)
Looking elsewhere, the Dow Jones Industrial Average has rallied more aggressively, rising to tag nearly one-month highs.
The rally places it comfortably atop its former breakdown point (29,653), outpacing the other benchmarks.
On further strength, the 50-day moving average is descending toward major resistance (31,145). Follow-through atop this area would strengthen the intermediate-term bull case.
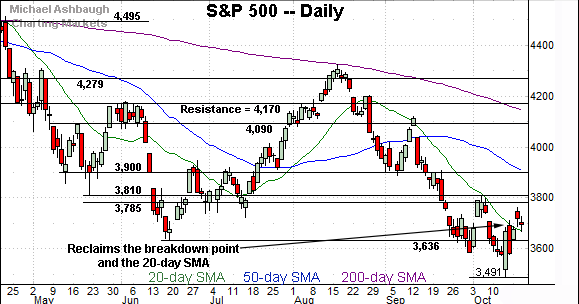
Meanwhile, the S&P 500 has not yet tagged one-month highs.
Still, the index has sustained a rally atop its breakdown point (3,636) as well as the 20-day moving average, currently 3,671.
Recall the week-to-date low (3,638) has closely matched the former breakdown point (3,636).
The bigger picture
As detailed above, the major U.S. benchmarks have sustained an October rally attempt.
On a headline basis, each index has reclaimed its breakdown point, and thus far maintained a posture higher.
As it applies to the S&P 500 and Nasdaq Composite, the week-to-date lows have closely matched major support — the S&P 3,636 and Nasdaq 10,565 areas, detailed repeatedly.
Moving to the small-caps, the iShares Russell 2000 ETF (IWM) has asserted a one-month range.
The initial strong-volume spike has thus far been capped by next resistance (177.50) detailed previously.
Similarly, the SPDR S&P MidCap 400 ETF (MDY) remains range-bound.
Here again, the recent upturn has been capped by resistance in the 429.70 area. (See the June gap.)
More broadly, recall the small- and mid-cap benchmarks have stabilized ahead of the major benchmarks. Eventual follow-through atop resistance would puncutate a double bottom, signaling the prevailing rally attempt may have legs.
Returning to the S&P 500, the index has registered a less aggressive rally attempt.
Nonetheless, the S&P has reclaimed its breakdown point (3,636), as well as the 20-day moving average, an area that has defined recent near-term trends.
From current levels, gap resistance (3,727) is followed by familiar overhead at 3,810. The October peak (3,807) has registered nearby.
On further strength, the 50-day moving average (in blue) is descending toward major resistance matching the 3,900 mark. Follow-through atop this area would signal an intermediate-term trend shift.
More broadly, the S&P 500’s bigger-picture backdrop remains bearish pending repairs.
(On a granular note, recall the S&P 500 is vying to maintain a posture atop its 200-week moving average, currently 3,606. Two of the prior three weekly closes have registered slightly lower amid an extended retest. See the Oct. 13 review.)
Watch List
Drilling down further, the Dow Transports (TRAN) have reached a major technical test.
Specifically, the group is pressing its breakdown point, an area matching trendline resistance and the September gap.
Broadly speaking, the 12,920-to-13,145 area marks notable overhead. Sustained follow-through higher would mark technical progress.
Meanwhile, the Financial Select Sector SPDR (XLF) has strengthened versus the transports.
As illustrated, the group has maintained its range bottom, reversing sharply last week amid a volume spike.
Tactically, the rally attempt has been capped by trendline resistance roughly matching the 50-day moving average, currently 32.82.
More broadly, the group has weathered a jagged test of its 200-week moving average, detailed previously. The pending upside follow-through, or lack thereof, will likely add color.
Scaling up in strength, the VanEck Oil Services ETF (OIH) is acting well technically.
As illustrated, the group has tagged four-month highs, clearing resistance amid a volume spike. The breakout punctuates a double bottom defined by the July and September lows.
Tactically, the breakout point (256.00) is followed by the 200-day moving average, currently 249.35. A sustained posture higher signals a comfortably bullish bias.
Similarly, the Energy Select Sector SPDR (XLE) is showing signs of life, rising to challenge four-month highs.
The prevailing upturn punctuates a tight October range, laying the groundwork for potentially decisive follow-through. Tactically, a breakout attempt is in play barring a violation of the 50-day moving average, currently 79.02.


