Charting a bear-trend whipsaw, U.S. benchmarks rally ahead of the Fed
Focus: Apple whipsaws at 200-day average, 10-year yield rises toward new target, China's technical breakdown, Gold and crude oil digest massive breakouts, AAPL, TNX, FXI, USO, GLD
Technically speaking, the major U.S. benchmarks continue to whipsaw, vacillating ahead of the Federal Reserve’s policy directive, due out mid-week.
Against this backdrop, the S&P 500 is rising from a very small double bottom defined by the March closing lows — at 4,170 and 4,173 — though sustainability and upside follow-through remain huge question marks.
Elsewhere, the Nasdaq Composite has reversed from a 15-month closing low to punctuate a 21.6% downturn from its record close.
Editor’s Note: As always, updates can be directly accessed at https://chartingmarkets.substack.com.
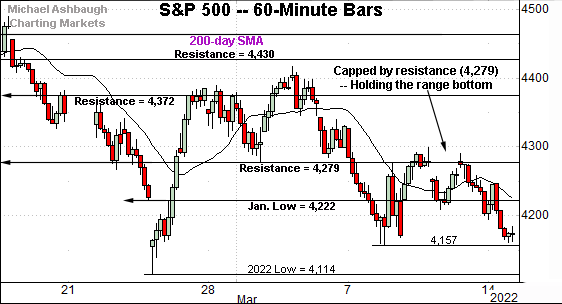
Before detailing the U.S. markets’ wider view, the S&P 500’s hourly chart highlights the past four weeks.
As illustrated, the S&P continues to hold its range bottom, in the broad sweep.
Tactically, initial resistance (4,222) is followed by the firmer breakdown point (4,279).
Last week’s closing high (4,278) matched resistance amid a failed retest from underneath.
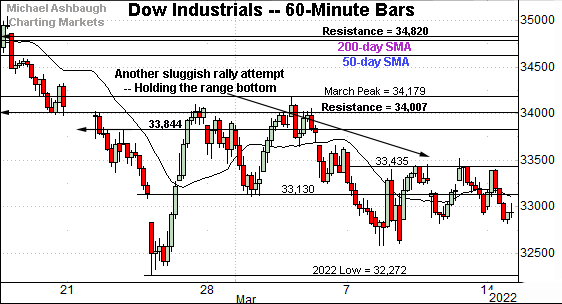
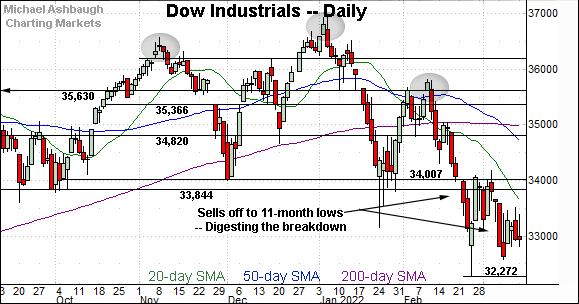
Similarly, the Dow Jones Industrial Average is generally holding its range bottom.
Tactically, near-term resistance (33,435) is followed by the more distant breakdown point (34,007) a familiar bull-bear fulcrum.
The index is approaching near-term resistance (33,435) early Tuesday.
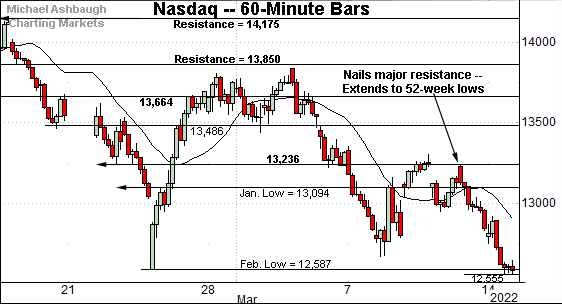
Against this backdrop, the Nasdaq Composite remains the weakest major benchmark.
Tactically, the index has failed its latest technical test, stalling near major resistance (13,236) detailed previously.
Friday’s session high (13,239) matched resistance, and the Nasdaq subsequently tagged 52-week lows Monday. Bearish price action.
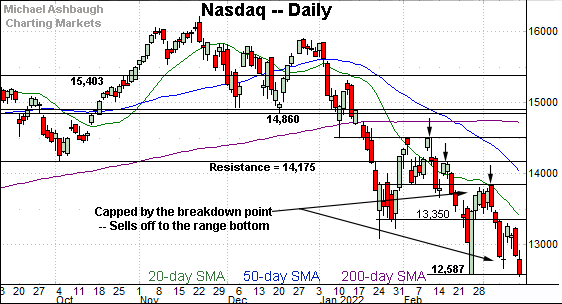
Widening the view to six months adds perspective.
On this wider view, the Nasdaq continues to trend broadly lower.
Consider that Monday’s close marked a 15-month closing low, the Nasdaq’s worst close since December 2020.
Against this backdrop, the Nasdaq has registered a 21.6% pullback from its record close, established Nov. 19, 2021.
Put differently, the Nasdaq has officially reached bear-market territory, eclipsing a 20% downturn.
Tactically, the prevailing leg lower originates from the breakdown point (13,850), a familiar bull-bear fulcrum. The March peak (13,837) registered slightly under resistance.
Looking elsewhere, the Dow Jones Industrial Average has not yet tagged new lows.
Still, the index is digesting its downdraft to a lower plateau, vacillating amid rally attempts that remain relatively sluggish.
More broadly, the March downturn originates from the breakdown point (34,007), a familiar bull-bear fulcrum.
The Dow’s intermediate- to longer-term bias remains firmly-bearish based on today’s backdrop.
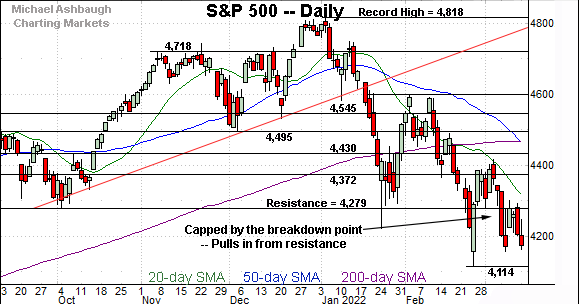
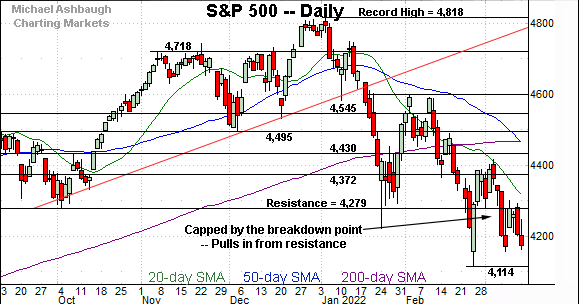
Meanwhile, the S&P 500 is also traversing a lower plateau.
Tactically, the breakdown point (4,279) — detailed repeatedly — remains the S&P’s first significant hurdle.
Last week’s closing high (4,278) matched resistance to punctuate a failed retest from underneath.
More broadly, notice the death cross — or bearish 50-day/200-day moving average crossover — an event that signaled Monday. Though the crossover is frequently a lagging indicator, it nonetheless exemplifies a still firmly-bearish six-month backdrop.
The bigger picture
As detailed above, the major U.S. benchmarks continue to whipsaw, pressured amid a bearish bigger-picture technical backdrop.
Amid the cross currents, the Nasdaq Composite has registered a 15-month closing low to punctuate a 21.6% downturn from its record close.
Tactically, the Nasdaq’s latest leg lower originates from major resistance (13,236) — detailed repeatedly — to punctuate a failed retest from underneath. (Friday’s session high (13,239) registered nearby.)
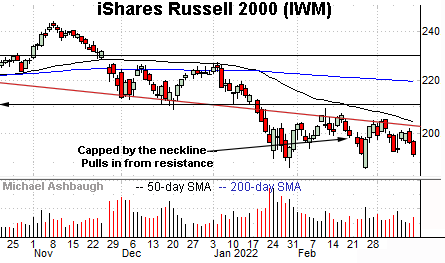
Moving to the small-caps, the iShares Russell 2000 ETF continues to traverse a lower plateau.
Tactically, the 50-day moving average, currently 203.40, is closely followed by the March peak (205.30). Follow-through atop this area would mark technical progress.
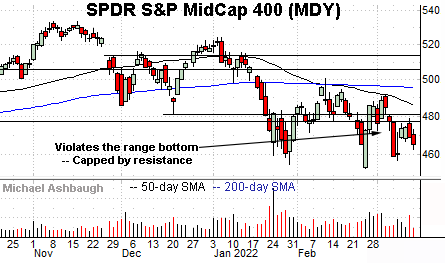
Meanwhile, the SPDR S&P MidCap 400 ETF has also asserted a lower plateau.
Tactically, the MDY’s breakdown point (477.50) is followed by the descending 50-day moving average. Recall the March peak effectively matched the 50-day moving average.
Returning to the S&P 500, the index is not acting well technically.
On a headline basis, the index last week registered a nine-month closing low (4,170) — its lowest close since June 2021.
The subsequent rally attempt nailed the breakdown point (4,279), a near-term inflection point, detailed repeatedly.
Recall last week’s closing high (4,278) matched resistance to punctuate a failed retest from underneath.
More immediately, the prevailing downturn from the breakdown point has been punctuated by Monday’s close (4,173) effectively matching the original closing low.
Against this backdrop, market bulls might point to a small developing double bottom defined by the March closing lows — at 4,170 and 4,173.
Tuesday’s early upturn punctuates the bullish reversal, though sustainability, and upside follow-through, remain major question marks. The response to the Federal Reserve’s policy statement, due out Wednesday afternoon, will likely add color.
Tactically, sustained follow-through atop the 4,280 area would mark an early step toward stabilization.
On further strength, more distant inflection points match the March peak (4,416) and the 50- and 200-day moving averages. The S&P 500’s intermediate- to longer-term bias remains bearish pending sustained follow-through atop this area.
Watch List
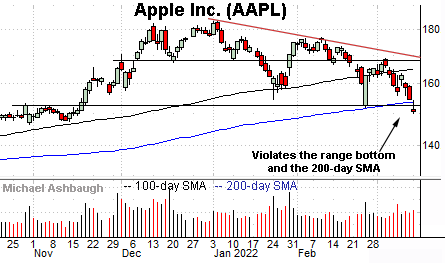
Drilling down further, Dow 30 component Apple, Inc. (AAPL) — the world’s largest company, as measured by market cap — has staged a headline technical event.
Specifically, the shares have violated the 200-day moving average, currently 153.87, an area closely matching major support (152.00).
As always, the 200-day is a widely-tracked longer-term trending indicator.
Tactically, a relatively swift reversal atop the 152.00-to-154.00 area would stabilize the backdrop, preserving a guardedly-bullish longer-term bias.
Conversely, a failed retest of this area from underneath — punctuated by downside follow-through — would confirm a bearish longer-term trend shift. The next several sessions will likely add color. (Also see the March 3 review for added context.)
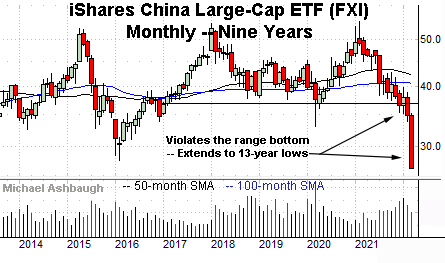
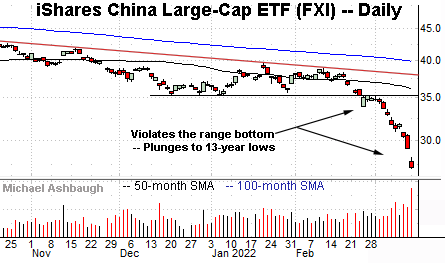
Looking elsewhere, the iShares China Large-Cap ETF (FXI) — profiled last week — has truly broken down.
Specifically, the shares have plunged to 13-year lows, the lowest levels since March 2009.
Recall the prevailing downdraft punctuates a massive double top defined by the 2018 and 2021 peaks. (See the nine-year chart.)
More broadly, consider that the final bar on the nine-year chart — the long red bar — represents March. From top to bottom, the March bar encompasses a 25.9% plunge across just two weeks.
The swift downdraft exemplifies an aggressive repricing — across regions and risk assets — that will likely require time to digest. Time will tell whether the downturn also portends a lasting structural economic shift.
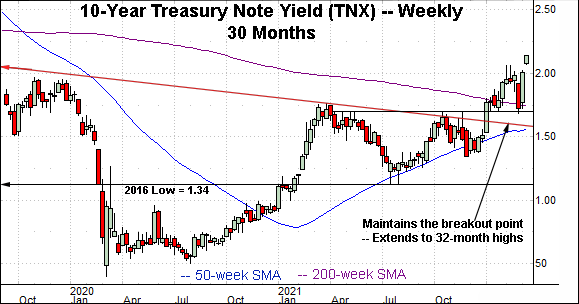
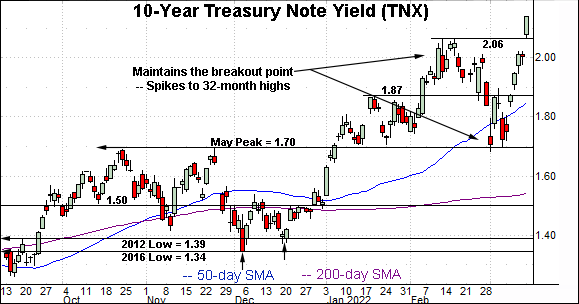
Amid recent cross currents, the 10-year Treasury note yield (TNX) continues to take flight.
In the process, the yield has knifed to 32-month highs, its highest level since July 2019.
Technically, the prevailing upturn originates from the former breakout point (1.70). An intermediate-term target projects to the 2.42 area.
More broadly, the breakout confirms a yield-bullish longer-term bias ahead of the Federal Reserve’s next policy directive. (Also see the March 11 review.)
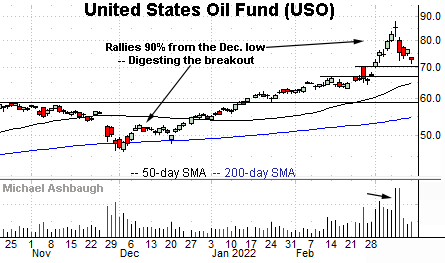
Looking elsewhere, the United States Oil Fund (USO) is digesting a massive technical breakout. The fund tracks the spot price of light, sweet crude oil.
Specifically, the shares are consolidating a massive 90.3% rally from the December low to the March peak.
The initial strong-volume March breakout has been punctuated by a comparably flat pullback (emphasis on comparably), fueled by recently decreased volume.
Fundamentally, rising energy prices and interest rates (yields) present a headwind to the outlook for U.S. stocks.
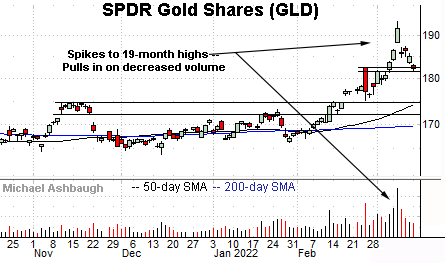
Finally, the SPDR Gold Shares ETF (GLD) is also digesting a massive technical breakout.
Here again, the prevailing pullback has been fueled by decreased volume to punctuate an initially aggressive spike to 19-month highs.
Fundamentally, gold has rallied amid a safe-haven trade and as an inflation hedge.
The initial pullback had been underpinned by first support — the 181.60-to-182.60 area — detailed March 7. Monday’s session low (181.95) effectively matched support, though the shares have followed through lower early Tuesday.
Tactically, a consolidation phase is in play, though gold’s longer-term bias remains firmly-bullish based on today’s backdrop.


