


Charting a 2024 breakout, S&P 500 (nearly) tags the 5,000 mark
Focus: Nasdaq approaches the 15,820 target

Technically speaking, the U.S. benchmarks’ bigger-picture backdrop remains comfortably bullish.
On a headline basis, the S&P 500 continues to tag all-time highs — rising within a fraction of the 5,000 mark — while the Dow Jones Industrial Average has rallied within striking distance of the 40,000 mark, a milestone just 3.4% above current levels.
Editor’s Note: As always, updates can be directly accessed at https://chartingmarkets.substack.com.
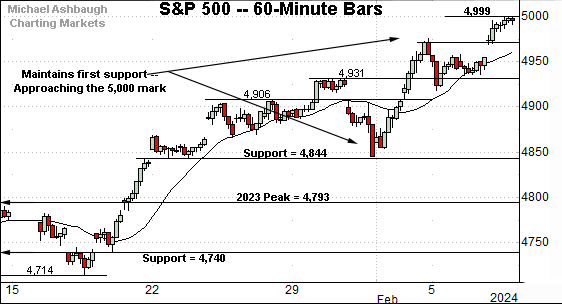
Before detailing the U.S. markets’ wider view, the S&P 500’s hourly chart highlights the past four weeks.
As illustrated, the S&P 500 has tagged its latest all-time high, rising within a fraction of the 5,000 mark.
The prevailing upturn originates from first support (4,844) an area detailed previously. (See the Jan. 24 review.) The late-January low (4,845) closely matched support amid a successful retest.

Meanwhile, the Dow Jones Industrial Average has sustained a jagged break to record highs.
The prevailing upturn punctuates a successful test of the breakout point (38,109). The February low (38,107) registered nearby.
Delving deeper, the 37,800-to-37,825 area marks a firmer floor, an area also illustrated on the daily chart.
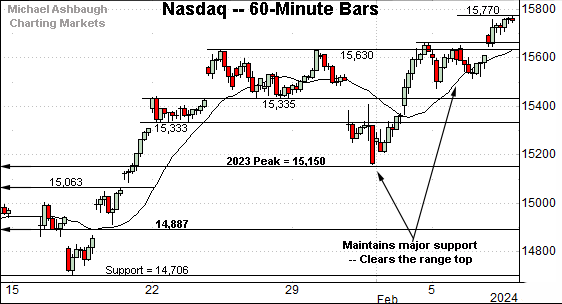
Against this backdrop, the Nasdaq Composite has tagged its latest two-year high.
The prevailing upturn originates from major support (15,150), an inflection point detailed previously. (See the Jan. 24 review.)
The late-January low (15,158) registered nearby.
More immediately, the 15,630 area pivots to first support.
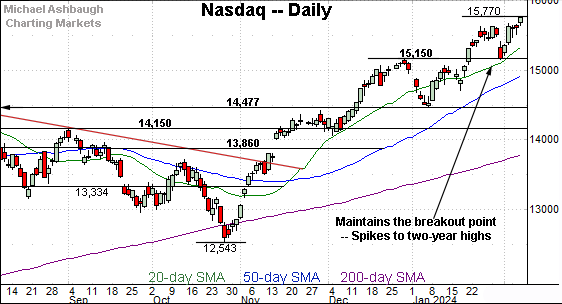
Widening the view to six months adds perspective.
On this wider view, the Nasdaq has tagged two-year highs, rising from a successful test of the breakout point (15,150). The 50-day moving average, currently 14,940, is rising toward support. This area marks a bull-bear fulcrum.
More broadly, an intermediate-term target continues to project to the 15,820 area, and is increasingly within view.
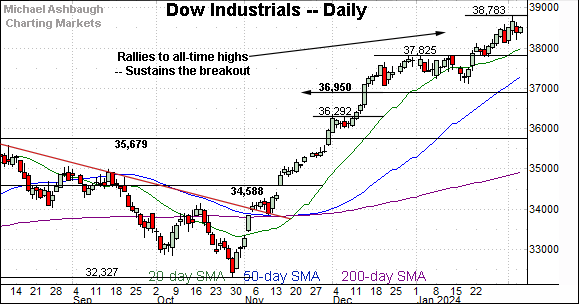
Looking elsewhere, the Dow Jones Industrial Average has staged a grinding-higher break to all-time highs.
Amid the upturn, the marquee 40,000 mark is within striking distance, about 3.4% above current levels.
Tactically, near-term floors are better illustrated on the hourly chart. More broadly, the Dow’s breakout point — the 37,800-to-37,825 area — marks a notable floor.
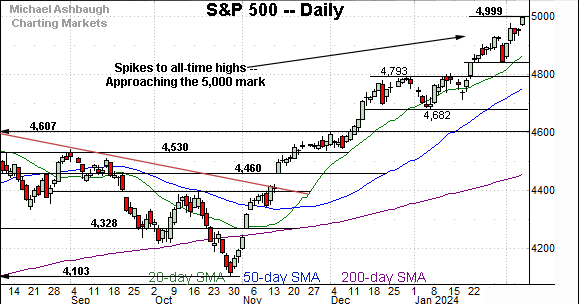
Meanwhile, the S&P 500 has extended a break to all-time highs.
Consider that the February peak (4,999.89), as this is written, has registered fractionally under the 5,000 mark.
Slightly more broadly, the prevailing upturn originates from first support (4,844) an area also illustrated on the hourly chart.
The bigger picture
As detailed above, the major U.S. benchmarks continue to trend steadily higher.
Amid the upturn, the S&P 500 and Dow industrials have registered record highs, while the Nasdaq Composite has tagged two-year highs, rising within striking distance of its intermediate-term target (15,820), detailed Jan. 24.
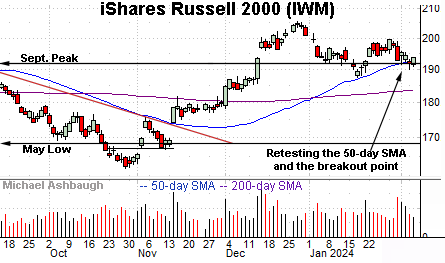
Moving to the small-caps, the iShares Russell 2000 ETF (IWM) continues to lag behind.
Still, the small-cap benchmark has thus far maintained its breakout point (191.86) — detailed previously — an area closely matching the 50-day moving average.
The February closing low (191.94) has effectively matched the breakout point. (See the Jan. 24 review.)
On a cautious note, the recent “lift” from support has been flat, and fueled by decreased volume. Tactically, a violation of the breakout point — and the slightly deeper January low (187.53) — would raise a caution flag. (Also note the 50-day moving average has marked a useful trending indicator going back before the November trend shift.)
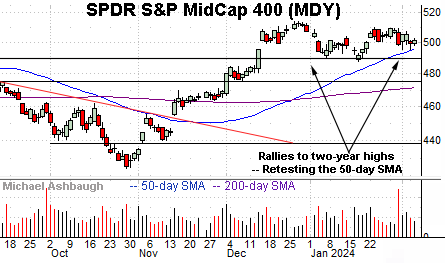
Meanwhile, the SPDR S&P MidCap 400 ETF (MDY) remains slightly stronger the small-caps.
As illustrated, the MDY has maintained a posture atop its breakout point, a level matching the Sept. peak (489.20).
And here again, the 50-day moving average, currently 496.82, has marked an inflection point going back before the November trendline breakout.

Returning to the S&P 500, the index continues to take flight.
Recent follow-through builds on a massive rally off the October low. From bottom to top, the S&P has spiked nearly 900 points, or 21.9%, across less than 15 weeks.
Against this backdrop, the prevailing upturns remain directionally sharp, and have been punctuated by comparably flat consolidation phases. (See the late-November and early-January price action.)
Bullish momentum is intact, based on today’s backdrop. (See the Jan. 10 review, for added detail regarding the internals.)
Tactically, the S&P’s breakout point (4,793) marks major support, a level matching the 2021 closing high (4,793) and the absolute 2023 peak (4,793).
Delving deeper, the 50-day moving average, currently 4,760, is rising toward the breakout point at a pace projected to match support by mid-month.
As always, it’s not just what the markets do, it’s how they do it. But generally speaking, the S&P 500’s bigger-picture bias remains bullish barring a violation of the 4,790 area.
Also see Jan. 24: Charting a bull-trend breakout, S&P 500 rises within view of 5,000 mark.
Also see Nov. 21: Charting a primary trend shift, S&P 500 clears key trendline amid 9-to-1 up day.