Charting a bull-trend breakout, S&P 500 rises within view of 5,000 mark
Focus: Dow industrials approach 40,000 mark, Small- and mid-caps continue to lag
Technically speaking, the major U.S. benchmarks are off to a bullish 2024 start.
On a headline basis, the S&P 500 and Dow industrials have concurrently tagged all-time highs, rising as the Nasdaq Composite has registered its best level in two years. The charts below add color:
Editor’s Note: As always, updates can be directly accessed at https://chartingmarkets.substack.com.
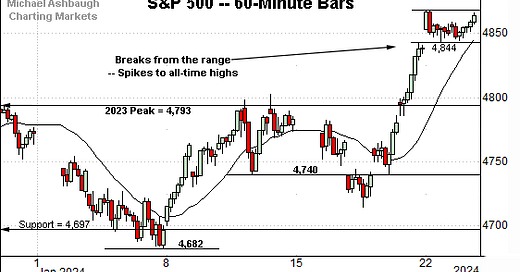
Before detailing the U.S. markets’ wider view, the S&P 500’s hourly chart highlights the past four weeks.
As illustrated, the S&P 500 has knifed to all-time highs.
The nearly straightline spike — (a statistically unusual two standard deviation breakout) — punctuates a jagged early-January range.
Tactically, the 4,793 area pivots to major support, a level matching the 2021 closing high (4,793) and the absolute 2023 peak (4,793).
Similarly, the Dow Jones Industrial Average has knifed to record highs.
The directionally sharp spike has been punctuated by a flattish pullback, and successful test of the breakout point (37,790).
Separately, the pullback has been underpinned by the 20-hour moving average, the hallmark of a powerful near-term trend.
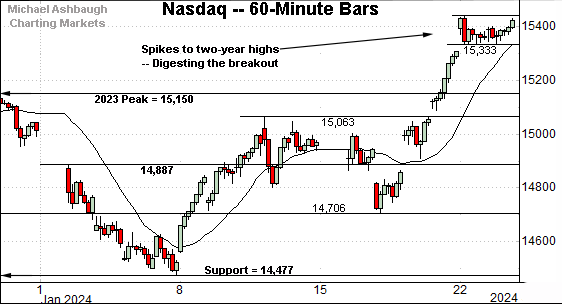
Against this backdrop, the Nasdaq Composite has knifed to two-year highs.
The subsequent flag-like pattern — the tight range, hinged to the steep breakout — signals still muted selling pressure, laying the groundwork for potential upside follow-through.
Tactically, the range bottom (15,333) is followed by the firmer breakout point (15,150).
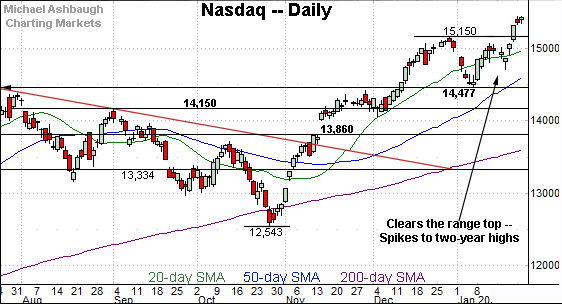
Widening the view to six months adds perspective.
On this wider view, the Nasdaq has knifed to two-year highs, rising from a jagged six-week range.
Tactically, an intermediate-term target projects from the former range to the 15,820 area. Conversely, the breakout point (15,150) pivots to support.
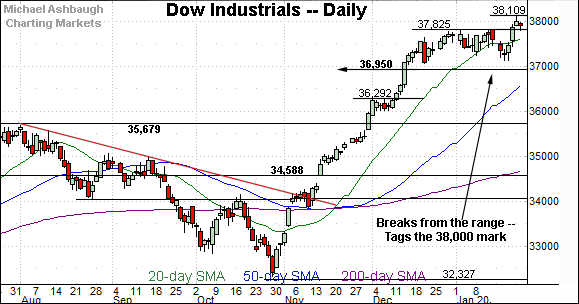
Looking elsewhere, the Dow Jones Industrial Average has staged a less decisive January breakout.
Still, the upturn marks another all-time high, placing the marquee 40,000 mark within striking distance. (About 5.2% from current levels.)
Tactically, the breakout point (37,825) is followed by support at 37,120 (see the hourly chart) and a deeper floor matching the 2022 peak (36,952).
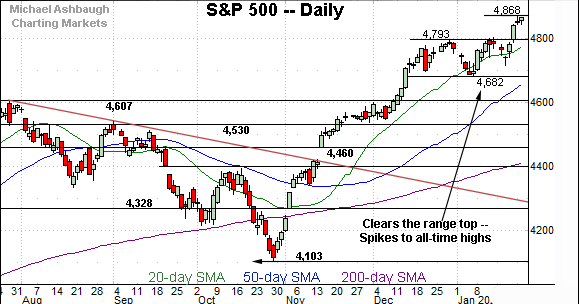
Meanwhile, the S&P 500 has also tagged all-time highs, reaching previously uncharted territory.
Tactically, the breakout point (4,793) pivots to well-defined support.
More broadly, the marquee 5,000 mark is increasingly within view, about 2.7% above current levels.
The bigger picture
As detailed above, the major U.S. benchmarks are off to a bullish 2024 start. Each big three benchmark has tagged new highs, building on an unusually powerful late-2023 rally.
Moving to the small-caps, the iShares Russell 2000 ETF (IWM) is not tagging new highs.
Instead, the small-cap benchmark has weathered a recent retest of its 50-day moving average, currently 189.40.
Tactically, the 50-day moving average is rising toward the breakout point (191.86). A sustained posture atop this area signals a bullish intermediate-term bias. (Also see the Jan. 10 review.)
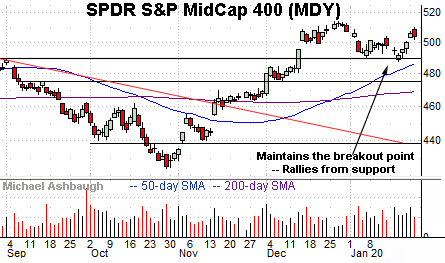
Meanwhile, the SPDR S&P MidCap 400 ETF (MDY) has strengthened slightly versus the small-caps.
As illustrated, the MDY has registered consecutive tests of its breakout point, a level matching the Sept. peak (489.20).
Combined, the small- and mid-cap benchmarks continue to digest their December breakouts. Though lagging behind the big three U.S. benchmarks, the January price action remains constructive, on balance.
Returning to the S&P 500, the index has knifed to all-time highs, rising from an orderly six-week range. The late-January follow-through builds on a previously massive rally off the October low.
Moreover, the January spike has marked another statistically unusual two standard deviation breakout, encompassing three straight closes atop the 20-day volatility bands.
Recent follow-through builds on the strong December breakout, punctuated by five straight closes atop the 20-day volatility bands. (The volatility bands are not illustrated, though two consecutive closes atop the bands mark a reliably bullish signal.)
More plainly, the prevailing rally has been fueled by unusually powerful bullish momentum, and the uptrend has been confirmed, from a technical standpoint, even as recently as this week. (Also see the Jan. 10 review, for added detail.)
Tactically, the S&P’s breakout point (4,793) pivots to support, a level matching the 2021 closing high (4,793) and the absolute 2023 peak (4,793).
Delving deeper, the 50-day moving average, currently 4,668, is rising toward the S&P’s former range bottom (4,682).
As always, it’s not just what the markets do, it’s how they do it. But generally speaking, the S&P 500’s bigger-picture bias remains bullish barring a violation of the 4,680 area. The response to the Federal Reserve’s next policy statement will likely add color.

