Charting a bullish technical tilt, Nasdaq extends to record territory
Focus: 10-year yield stabilizes after the Fed, Microsoft tags $2 trillion mark, TNX, MSFT, COST, RUN, NET
U.S. stocks are mixed mid-day Wednesday, vacillating after a mixed batch of economic data.
Against this backdrop, the S&P 500 has lifted to challenge all-time highs — topping early Wednesday within one point of an intraday record — while the Nasdaq Composite has slightly extended a grinding-higher break to record territory.
Editor’s Note: As always, updates can be directly accessed at chartingmarkets.substack.com.
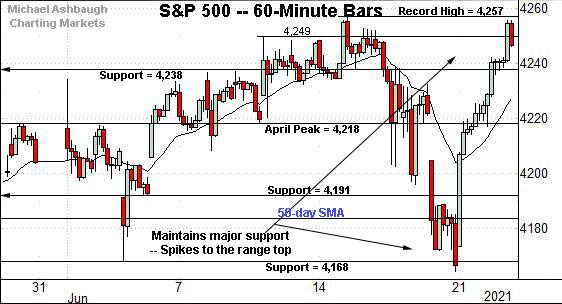
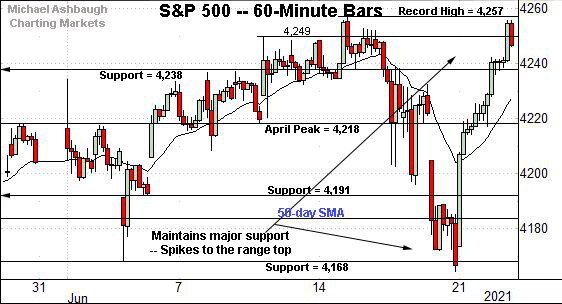
Before detailing the U.S. markets’ wider view, the S&P 500’s hourly chart highlights the past four weeks.
As illustrated, the S&P has staged a bullish reversal from familiar support. Recall last week’s close (4,166) roughly matched the former range bottom (4,168) detailed repeatedly.
The subsequent aggressive spike to the range top preserves the prevailing range.
Tactically, the S&P’s record close (4,255.15) and absolute record peak (4,257.16) rest just overhead.
Wednesday’s early session high (4,256.60) has effectively matched the record highs.
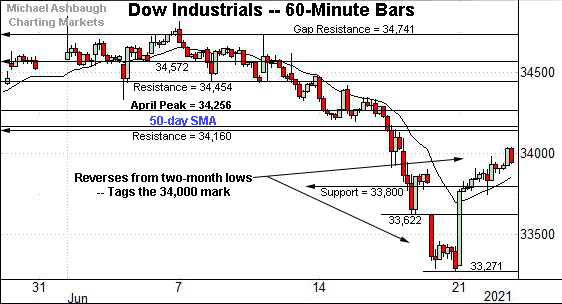
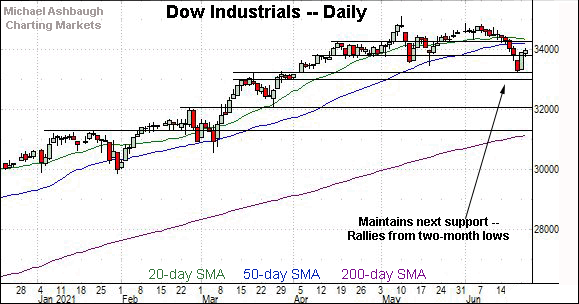
Meanwhile, the Dow Jones Industrial Average remains the weakest major benchmark.
Still, the index has reversed atop the 33,800 area, the Dow’s former range bottom, detailed on the daily chart.
Tactically, additional resistance (34,160) is closely followed by the 50-day moving average, currently 34,194.
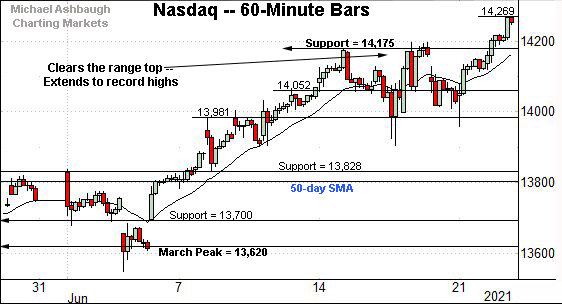
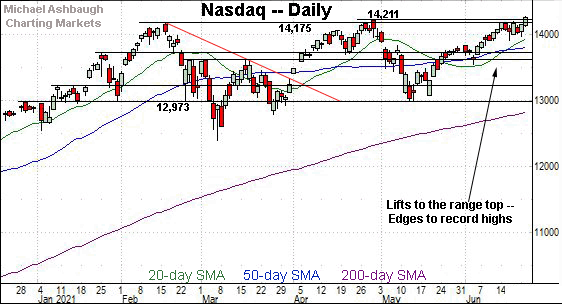
Against this backdrop, the Nasdaq Composite has tagged record highs.
The prevailing upturn punctuates a jagged flag-like pattern, underpinned by near-term support (13,980).
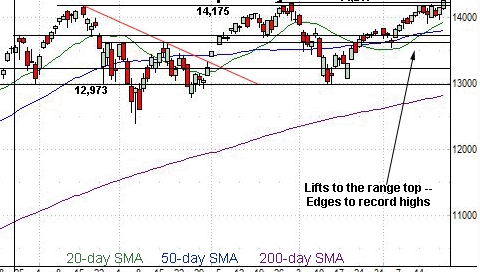
Widening the view to six months adds perspective.
On this wider view, the Nasdaq has edged to uncharted territory, punctuating a double bottom defined by the March and May lows.
Tactically, significant support broadly spans from 14,175 to 14,211, levels matching the February and April peaks.
Conversely, a near-term target projects to the 14,380 area.
More broadly, an intermediate-term target projects from the Nasdaq’s double bottom to the 15,420 area.
(Note the Nasdaq’s prevailing 0.3% breakout is less than impressive. Still, the second quarter concludes next week, laying the groundwork for potentially more decisive follow-through.)
Looking elsewhere, the Dow industrials’ six-month backdrop remains strikingly softer.
Nonetheless, the index has reversed respectably from two-month lows. The swift reversal atop the 33,800 area signals market bears lack control. (This area “should” have drawn selling pressure if a durable breakdown were in play.)
Tactically, more distant overhead (34,160) is closely followed by the 50-day moving average, currently 34,194.
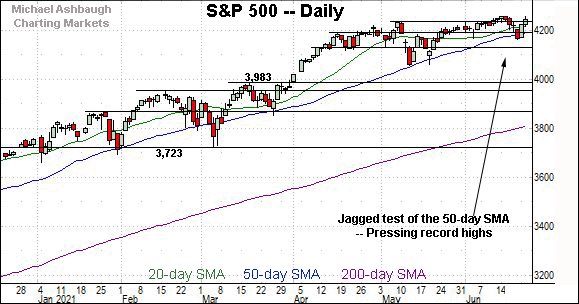
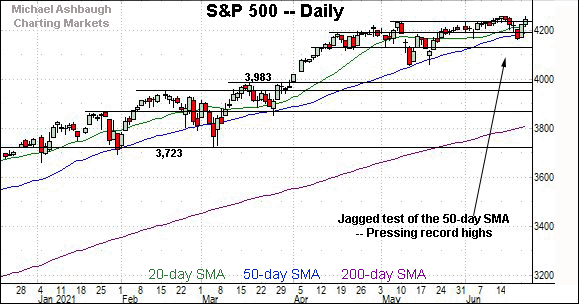
Meanwhile, the S&P 500 has weathered its latest jagged test of the 50-day moving average, currently 4,188.
The prevailing upturn originates from familiar support (4,168) better illustrated on the hourly chart.
The bigger picture
Collectively, the major U.S. benchmarks remain in divergence mode with just one week remaining until the second quarter concludes.
Against this backdrop, each benchmark has registered the following quarter-to-date performance through Tuesday’s close:
The Dow Jones Industrial Average has added 964 points, or 2.9%.
The Nasdaq Composite has rallied 1,006 points, or 7.6%.
The S&P 500 has gained 274 points, or 6.9%.
So to the extent that window-dressing is a factor, the prevailing backdrop points to a month-end tailwind.
Moving to the small-caps, the iShares Russell 2000 ETF remains range-bound.
Tactically, the former range top — the 230.30-to-230.95 area — marks an overhead inflection point.
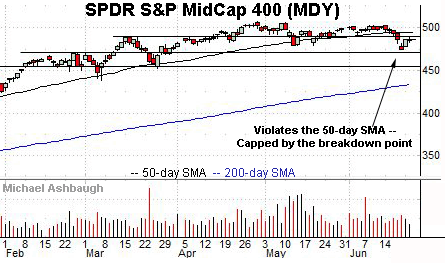
Meanwhile, the SPDR S&P MidCap 400 ETF has asserted a posture slightly under its 50-day moving average, currently 494.68.
But here again, a largely flatlining backdrop remains in play.
Placing a finer point on the S&P 500, the index has reversed sharply from familiar support (4,168). Last week’s low (4,166) registered nearby.
More immediately, the bullish reversal places the S&P’s record close (4,255.15) and absolute record peak (4,257.16) firmly within view.
To reiterate, Wednesday’s early session high (4,256.60) has effectively matched the record highs.
More broadly, the S&P 500 has reversed from its third single-session close under the 50-day moving average since Nov. 4.
Prior retests have punctuated an intermediate-term low, and subsequent resumption of the uptrend.
On further strength, an intermediate-term target projects from the May range to the 4,310 area — detailed repeatedly — and from the recent Fed-fueled whipsaw to the 4,350 area. (The latter target technically projects to 4,348.)
Beyond specific levels, the S&P 500’s intermediate-term bias remains bullish, following a successful test of its one-month range bottom.
Watch List
Drilling down further, consider the following sectors and individual names:
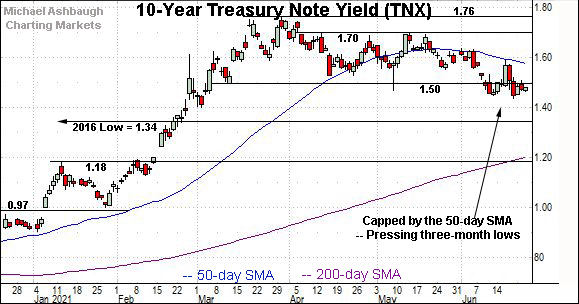
To start, the 10-year Treasury Note Yield is digesting a downturn in the wake of the Federal Reserve’s latest policy directive.
Note the yield topped precisely at the 50-day moving average last Wednesday, the day of the Fed’s statement. (The June 16 high (1.594) matched the 50-day moving average, then also 1.594, to the decimal.)
More immediately, the yield has stabilized this week slightly under the 1.50 mark.
Tactically, the June low (1.44) is followed by a significant longer-term inflection point matching the 2016 low (1.34).
Conversely, the 1.50 area is followed by the 50-day moving average, currently 1.58. An eventual close atop the 50-day could conclude the yield’s modest downtrend from the March peak.
Moving to specific names, Dow 30 component Microsoft Corp. has reached a headline milestone.
Specifically, the company has become just the second U.S. company to exceed a $2 trillion value, as measured by market cap, joining Apple, Inc. as the only companies to surpass the milestone.
Technically, the prevailing upturn originates from trendline support — at the June low — placing the shares in record territory. The breakout point (263.20) pivots to first support.
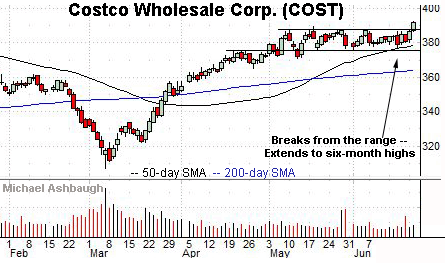
Costco Wholesale Corp. is a well positioned large-cap discount retailer.
As illustrated, the shares have reached six-month highs, clearing resistance matching the May peak. The upturn punctuates a relatively tight nearly two-month range.
Tactically, the breakout point (387.50) pivots to support.
Conversely, Costco’s record high (393.15) — established Nov. 30, 2020 — is firmly within view. On further strength, a slightly more distant target projects from the former range to the 398 area.
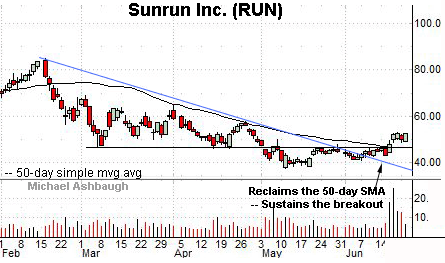
Sunrun, Inc. is a large-cap developer of residential solar systems.
Late last week, the shares knifed atop the 50-day moving average, rising amid a volume spike after an analyst upgrade.
The subsequent tight range has formed amid decreased volume, positioning the shares to build on the initial spike.
Tactically, the 50-day moving average closely matches the breakout point (46.70). The prevailing rally attempt is intact barring a violation.
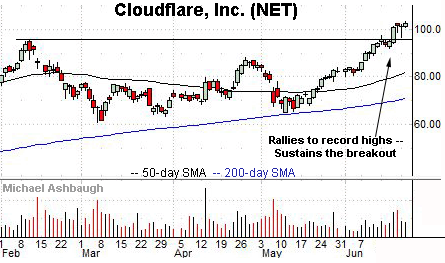
Public since September 2019, Cloudflare, Inc. is large-cap provider of cybersecurity and infrastructure-as-a-service solutions.
Technically, the shares have recently reached record territory, clearing resistance matching the February peak.
The subsequent pullback has been flat, fueled by decreased volume, positioning the shares for potential upside follow-through. Tactically, a sustained posture atop the breakout point (95.70) signals a firmly-bullish bias.

