Bull trend confirmed: S&P 500, Nasdaq extend June breakouts
Focus: Financials retest the breakdown point, Gold's bull-flag breakdown, XLF, GLD, CRM, BYND, QCOM, TXG
Technically speaking, the major U.S. benchmarks are concluding the second quarter amid a largely bullish bigger-picture backdrop.
On a headline basis, the S&P 500 and Nasdaq Composite have extended June breakouts — reaching uncharted territory — rising in grinding-higher form to confirm their primary uptrend.
Editor’s Note: As always, updates can be directly accessed at chartingmarkets.substack.com. Your smartphone can also access updates at the same address.
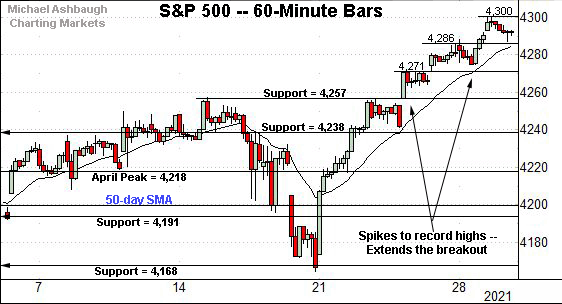
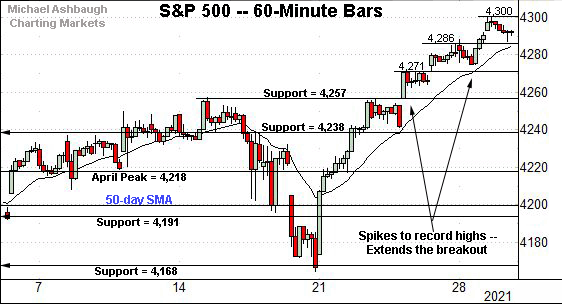
Before detailing the U.S. markets’ wider view, the S&P 500’s hourly chart highlights the past four weeks.
As illustrated, the S&P has extended its late-June breakout. The nearly straightline rally has trended atop the 20-hour moving average, signaling a strong near-term trend.
Tactically, near-term floors — around 4,286 and 4,271 — are followed by the firmer breakout point (4,257).
More broadly, recall the sharp late-June rally originates from major support (4,168).
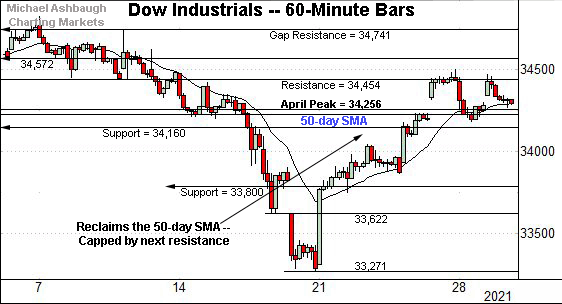
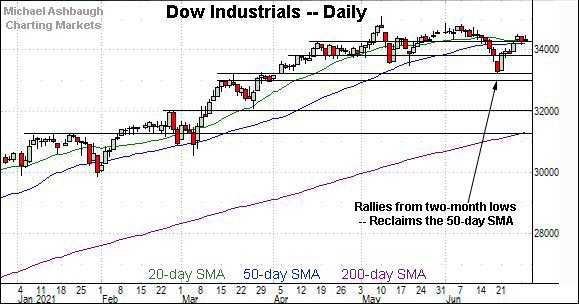
True to recent form, the Dow Jones Industrial Average remains the weakest major benchmark.
Nonetheless, the index has sustained a modest break atop the 50-day moving average, currently 34,228.
Conversely, the Dow’s breakdown point (34,454) — detailed repeatedly — remains an overhead hurdle.
Wednesday’s early session high (34,450) has registered nearby.
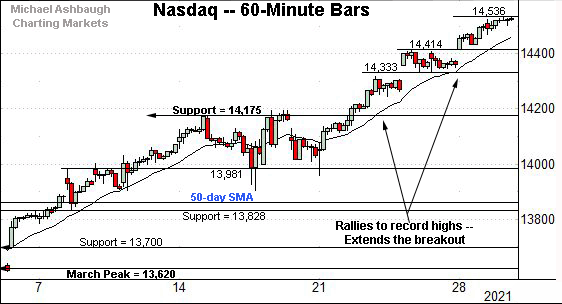
Against this backdrop, the Nasdaq Composite continues to take flight.
This week’s follow-through punctuates a bull-flag breakout.
Tactically, last week’s high (14,414) and the week-to-date low (14,417) closely match. This area marks a near-term floor.
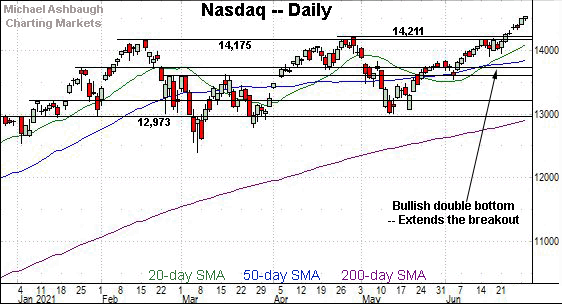
Widening the view to six months adds perspective.
On this wider view, the Nasdaq has extended its late-June breakout, rising from a well-documented double bottom.
The prevailing upturn marks a respectable 2.2% technical breakout, confirming the primary uptrend.
As detailed previously, an intermediate-term target projects to the 15,420 area.
Looking elsewhere, the Dow Jones Industrial Average continues to lag behind.
Still, the index has sustained its bullish reversal to a higher plateau.
Tactically, familiar inflection points match the April peak (34,256) and the 50-day moving average, currently 34,228.
Tuesday’s session low (34,266) registered nearby amid a successful retest.
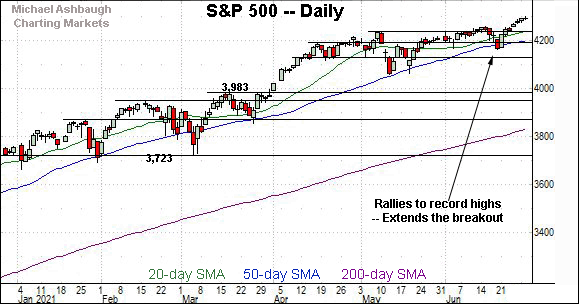
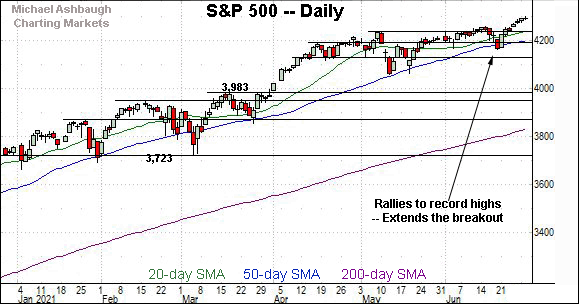
Meanwhile, the S&P 500 has extended a grinding-higher break to record territory.
Recent follow-through punctuates a nearly 1.4% breakout, technically confirming the primary uptrend.
The bigger picture
Collectively, the major U.S. benchmarks are concluding the second quarter amid a largely bullish backdrop, despite a slight divergence.
On a headline basis, the S&P 500 and Nasdaq Composite have extended June breakouts, confirming their respective primary uptrends.
Meanwhile, the Dow Jones Industrial Average is vying to simply sustain its break to a higher plateau atop the 50-day moving average. (See the daily chart.)
(As always, with just 30 components, the Dow industrials are the least representative major benchmark, reducing the significance of the prevailing divergence.)
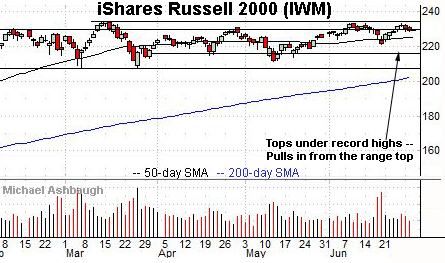
Moving to the small-caps, the iShares Russell 2000 ETF has balked at its range top.
Tactically, its record close (234.42) and absolute record peak (234.53) remain within view.
Separately, the small-cap benchmark’s former range top (229.60) remains an inflection point.
Placing a finer point on the S&P 500, the index has thus far topped at the 4,300 mark, rising from consecutive flag patterns.
Recall the steep reversal from the June low has trended steadily atop the 20-hour moving average. Bullish price action.
More broadly, the grinding-higher follow-through punctuates a nearly 1.4% breakout, confirming the primary uptrend.
Tactically, the S&P’s first notable floors — around 4,257 and 4,238 — match the June breakout points.
This is followed by the 50-day moving average, currently 4,201, and the 4,191 support.
Delving deeper, the late-June breakout originates from major support (4,168) — detailed repeatedly — a level better illustrated on the hourly chart. Recall the June closing low (4,166) effectively matched support.
Tactically, an eventual violation of the 4,166 area would mark a “lower low” — combined with a violation of the 50-day moving average — raising a technical question mark.
Conversely, familiar upside targets project from the May range to the 4,310 area, and from the mid-June Fed-fueled whipsaw to the 4,350 area. (The latter target technically projects to 4,348.)
Beyond specific levels, the S&P 500’s intermediate-term bias remains bullish, based on today’s backdrop, though amid still narrowing sub-sector participation. The response to the monthly U.S. jobs report, due out Friday, will likely add color.
Editor’s Note: The next review will be published next Wednesday. The U.S. markets are closed Monday, July 4 for Independence Day. Have a great long weekend!
Watch List
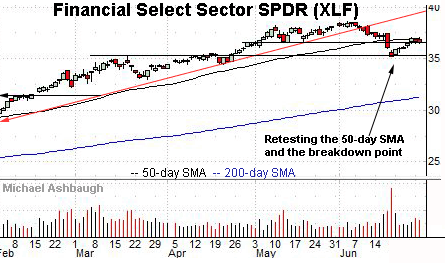
Drilling down further, the Financial Select Sector SPDR’s backdrop exemplifies a potential third-quarter market overhang.
Namely, the mid-June downturn inflicted sub-sector damage, and has been punctuated by narrowing market participation, increasingly concentrated in the so-called FANG names.
Technically, the XLF has staged a corrective bounce from two-month lows, rising to retest the breakdown point (36.55) and the 50-day moving average, currently 37.00.
The prevailing retest of this area should be a useful intermediate-term bull-bear gauge. Very recent selling pressure at the 50-day has registered amid a volume uptick.
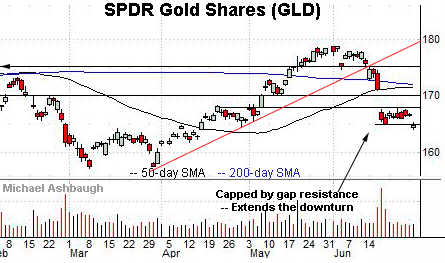
Meanwhile, the SPDR Gold Shares ETF is pacing its worst monthly performance since 2016.
The shares initially plunged two weeks ago, gapping sharply lower after the Federal Reserve’s hawkish-leaning policy statement.
The subsequent rally attempt has been flat, and punctuated by this week’s downside follow-through. The chart illustrates a bull-flag breakdown, of sorts.
Tactically, the breakdown point (164.93) is followed by the late-month range top (168.03). A rally atop this area would mark a step toward stabilization.
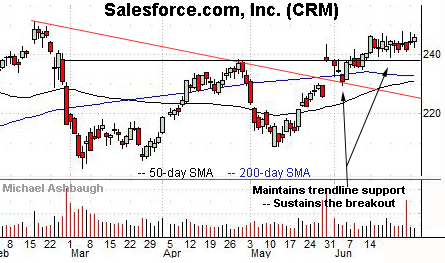
Salesforce.com, Inc. is a well positioned large-cap name.
The shares initially spiked four weeks ago, gapping atop the 200-day moving average after the company’s first-quarter results.
The subsequent pullback has been underpinned by trendline support — and punctuated by a June flag-like pattern — positioning the shares to extend the rally attempt. Tactically, a sustained posture atop the breakout point (237.80) signals a bullish bias.
More broadly, notice the bullish double bottom defined by the March and May lows.
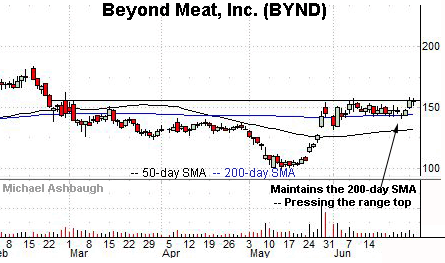
Public since May 2019, Beyond Meat, Inc. is a large-cap producer of plant-based meat products.
As illustrated, the shares have rallied to the range top, rising to challenge four-month highs.
The prevailing upturn punctuates a tight June range — hinged to the steep May rally — laying the groundwork for potentially decisive follow-through.
Tactically, a breakout attempt is in play barring a violation of the 200-day moving average, currently 144.20.
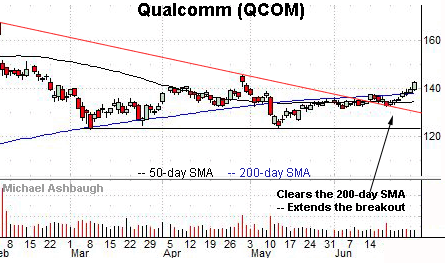
Qualcomm, Inc. is a large-cap semiconductor name coming to life.
Technically, the shares have extended recent trendline breakout, reaching two-month highs.
Underlying the upturn, its relative strength index (not illustrated) has registered its best levels since December, improving the chances of longer-term follow-through.
Tactically, the 200-day moving average, currently 138.00, has marked a bull-bear inflection point. A sustained posture higher signals a bullish bias.
More broadly, the prevailing upturn punctuates a developing double bottom defined by the March and May lows.
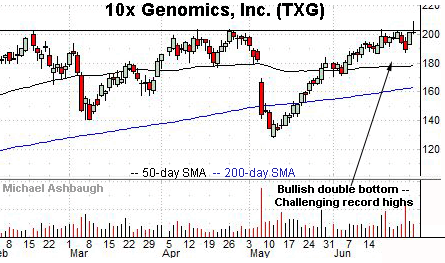
Finally, 10x Genomics, Inc. — public since September 2019 — is a large-cap developer of instruments for analyzing biological systems (a.k.a. genomic instruments).
As illustrated, the shares have recently held tightly to the range top, challenging record highs. The prevailing upturn punctuates a double bottom defined by the March and May lows.
Tactically, a breakout attempt is in play barring a violation of near-term support, circa 189.70.
Note that 10x Genomics is known as a Cathie Wood name, a component of both the ARK Innovation (ARKK) and ARK Genetic Revolution (ARKG) ETFs.
Editor’s Note: The next review will be published next Wednesday. The U.S. markets are closed Monday, July 4 for Independence Day. Have a great long weekend!


