Charting bullish follow-through, S&P 500 tags latest record high
Focus: Semiconductor sector's stealth breakout attempt, Alibaba's trendline breakout, SMH, BABA, NTNX, SPLK, KLIC, FSLR
U.S. stocks are mixed early Monday, vacillating as the markets prepare to conclude the second quarter mid-week.
Against this backdrop, the S&P 500 and Nasdaq Composite continue to broadly hold record highs, while the Dow industrials vie to simply maintain a posture atop the 50-day moving average, currently 34,211.
Editor’s Note: As always, updates can be directly accessed at chartingmarkets.substack.com.
Before detailing the U.S. markets’ wider view, the S&P 500’s hourly chart highlights the past four weeks.
As illustrated, the S&P has extended its break to record territory.
Tactically, near-term support (4,271) is followed by the firmer breakout point (4,257).
More broadly, recall the sharp late-June rally originates from major support (4,168). Bullish price action.
Meanwhile, the Dow Jones Industrial Average continues to lag behind.
Nonetheless, the index has extended its rally attempt, reclaiming the 50-day moving average, currently 34,211.
The Dow’s breakdown point (34,454) has thus far capped the bullish reversal. Last week’s close (34,433) registered slightly under resistance, detailed previously.
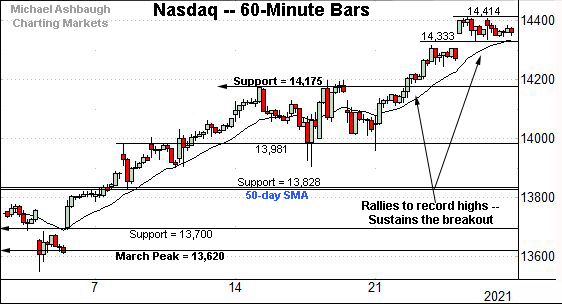
Against this backdrop, the Nasdaq Composite has sustained its late-June breakout.
The prevailing flag pattern — the tight two-session range, underpinned by gap support (14,333) — signals still muted selling pressure near record highs.
(On a granular note, the post-breakout low (14,338) closely matches the top of the gap (14,333).)
Widening the view to six months adds perspective.
On this wider view, the Nasdaq has sustained its late-June breakout. The prevailing upturn punctuates a double bottom defined by the March and May lows.
Tactically, an intermediate-term target continues to project to the 15,420 area.
Conversely, the breakout point — broadly speaking, the 14,175-to-14,211 area — pivots to notable support.
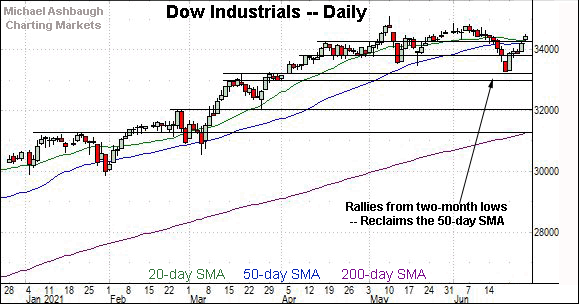
Looking elsewhere, the Dow Jones Industrial Average remains the weakest major benchmark.
Still, the index has extended its rally from two-month lows, reclaiming the 50-day moving average, currently 34,211.
Monday’s early session low (34,206) has registered nearby.
Separately, the April peak (34,256) remains an inflection point, also detailed on the hourly chart.
Meanwhile, the S&P 500 has extended its break to record territory.
The prevailing upturn marks a precisely 1.00% technical breakout — through last week’s close — roughly sufficient to confirm the primary uptrend.
(Beyond technicalities, the S&P’s prevailing breakout gets mixed marks for style.)
The bigger picture
As detailed above, the major U.S. benchmarks seem to be setting up for a largely bullish second-quarter conclusion, Wednesday, June 30.
On a headline basis, the S&P 500 and Nasdaq Composite have both recently registered record closes amid respectable late-month breakouts.
Meanwhile, the still lagging Dow industrials have nonetheless reached a higher plateau atop the 50-day moving average.
Moving to the small-caps, the iShares Russell 2000 ETF is approaching all-time highs.
Recall the record close (234.42) is closely followed by the absolute record peak (234.53).
Last week’s high (233.41) registered firmly within striking distance. The pending retest from underneath will likely add color.
Placing a finer point on the S&P 500, the index has extended its June breakout.
The nearly straightline spike punctuates a successful test of the range bottom (4,168), detailed repeatedly. The June 18 weekly close (4,166) roughly matched support.
From current levels, the S&P’s breakout point (4,257) marks its first notable floor.
More broadly, the S&P’s late-June breakout punctuates a jagged test of the 50-day moving average, currently 4,194.
Against this backdrop, last week’s close punctuated a precisely 1.00% technical breakout, a benchmark frequently viewed as the marker for a trend’s confirmation.
To be sure, the S&P’s prevailing breakout has registered amid narrowing participation in the wake of the mid-June Fed-fueled market whipsaw. A turn-of-the-quarter downturn, to start July, is a potential “watch out.”
Nonetheless, the S&P’s grinding-higher follow-through is broadly constructive based on today’s backdrop. Its intermediate-term target — the 4,310 area — is increasingly within view.
Watch List
Drilling down further, consider the following sectors and individual names:
To start, the VanEck Vectors Semiconductor ETF is setting up well technically.
As illustrated, the group has rallied toward the range top, rising within view of record territory.
The prevailing upturn punctuates a relatively tight June range underpinned by the 50-day moving average.
More broadly, notice the developing double bottom — the W formation — defined by the March and May lows. A near-term target projects to the 267 area on follow-through.
Tactically, the June low (244.80) closely matches the 50-day moving average, currently 244.85. A breakout attempt is in play barring a violation.
Alibaba Group Holding Ltd. is a large-cap China-based name coming to life.
As illustrated, the shares have knifed to six-week highs, rising from a double bottom defined by the May and June lows. The strong-volume breakout confirms Alibaba’s recent trend shift.
Tactically, the breakout point (223.10) is followed by the 50-day moving average, currently 219.60. The prevailing rally attempt is intact barring a violation.
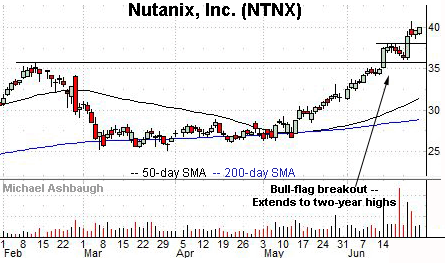
Nutanix, Inc. is a well positioned large-cap cloud infrastructure name.
Earlier this month, the shares knifed to two-year highs, clearing resistance matching the February peak. The subsequent flag-like pattern has been punctuated by upside follow-through.
Tactically, a sustained posture atop the former range top (37.50) signals a firmly-bullish bias.
More broadly, the shares are well positioned on the three-year chart, placing distance atop pandemic-zone territory.
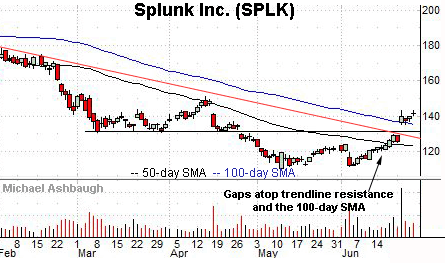
Splunk, Inc. is a large-cap provider of software and cloud solutions.
Technically, the shares have recently gapped atop trendline resistance, rising after the company received a $1 billion investment and announced a share buyback program.
The subsequent pullback has been flat — underpinned by the top of the gap (135.20), and the 100-day moving average — positioning the shares to build on the initial spike.
Kulicke and Soffa Industries, Inc. is a mid-cap Singapore-based chip equipment name.
As illustrated, the shares have knifed to record highs, rising ahead of the company’s addition to the Russell 2000 and Russell 3000 benchmarks, effective after the close Monday, June 28.
Tactically, the breakout point (59.40) is followed by the former range top (57.50). The prevailing rally attempt is intact barring a violation.
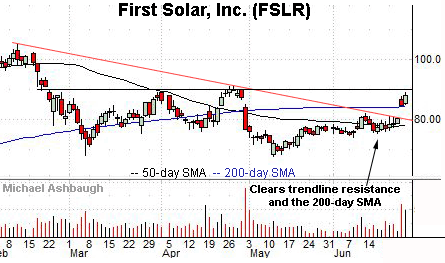
Finally, First Solar, Inc. is a large-cap name showing signs of life.
Late last week, the shares gapped atop trendline resistance, rising after the U.S. barred some solar products made in China.
The prevailing upturn punctuates a developing double bottom defined by the March and May lows.
Tactically, gap support (84.36) closely matches the 200-day moving average, currently 84.32. A breakout attempt is in play barring a violation.


